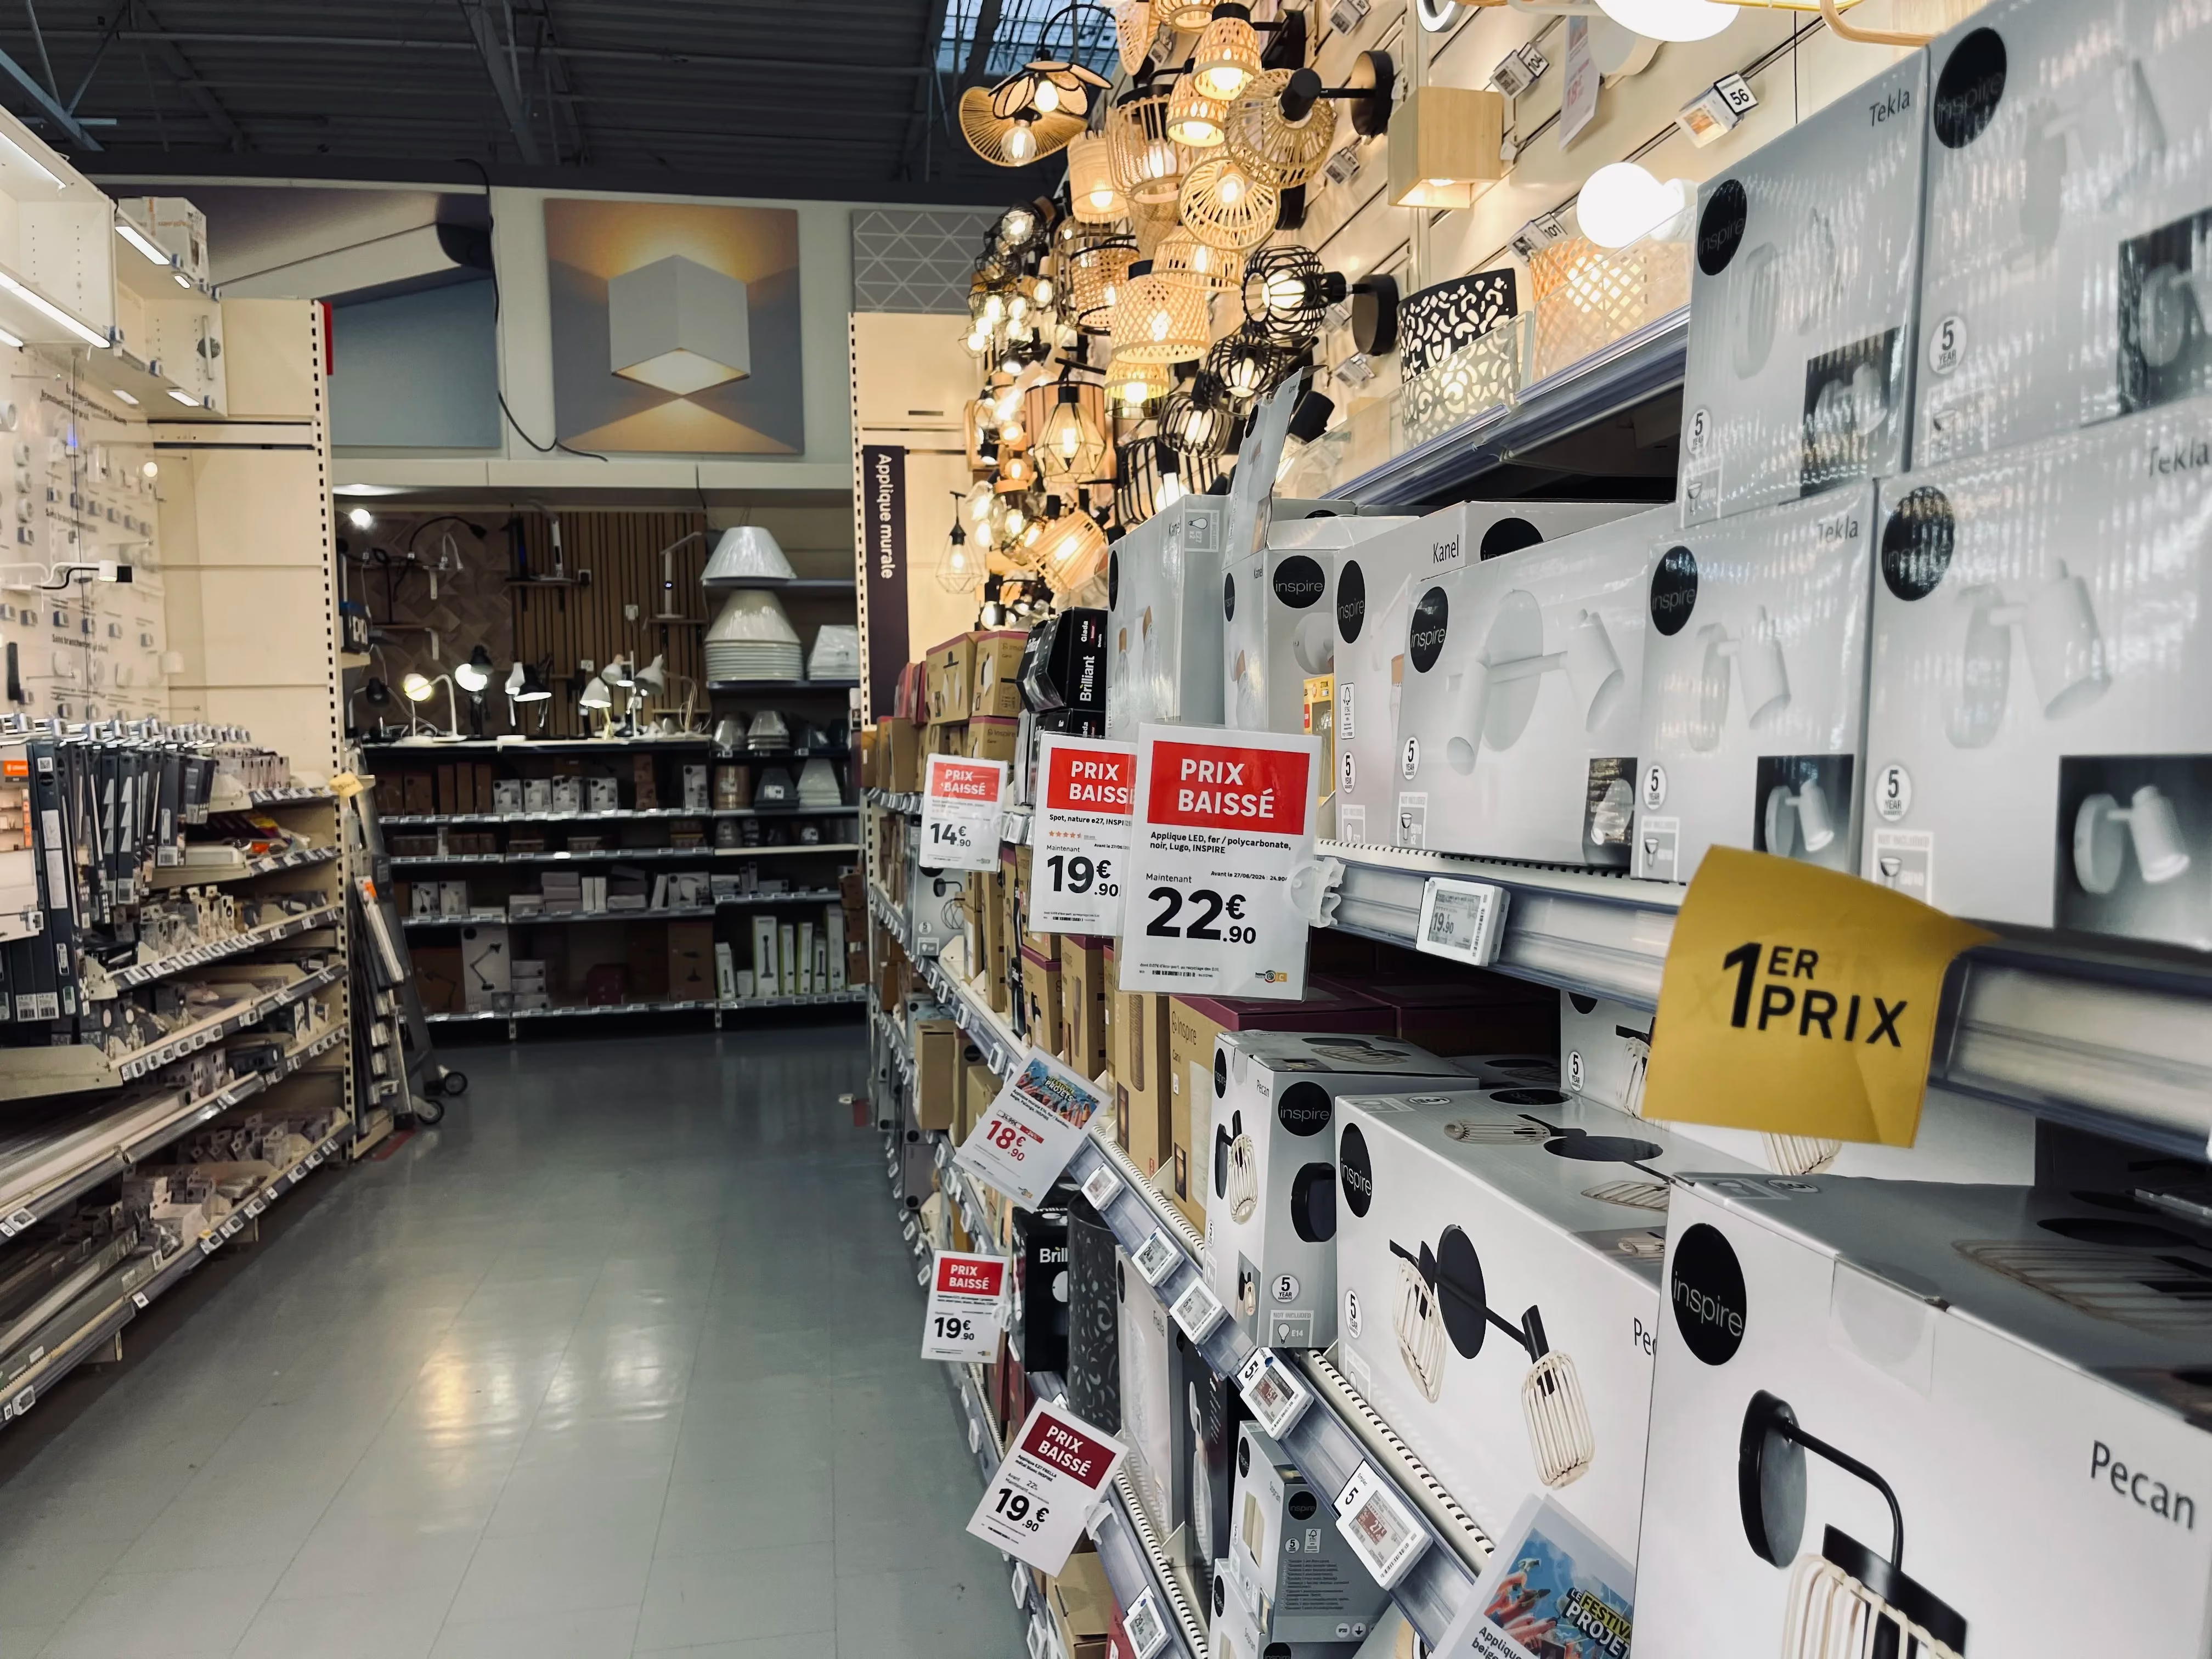
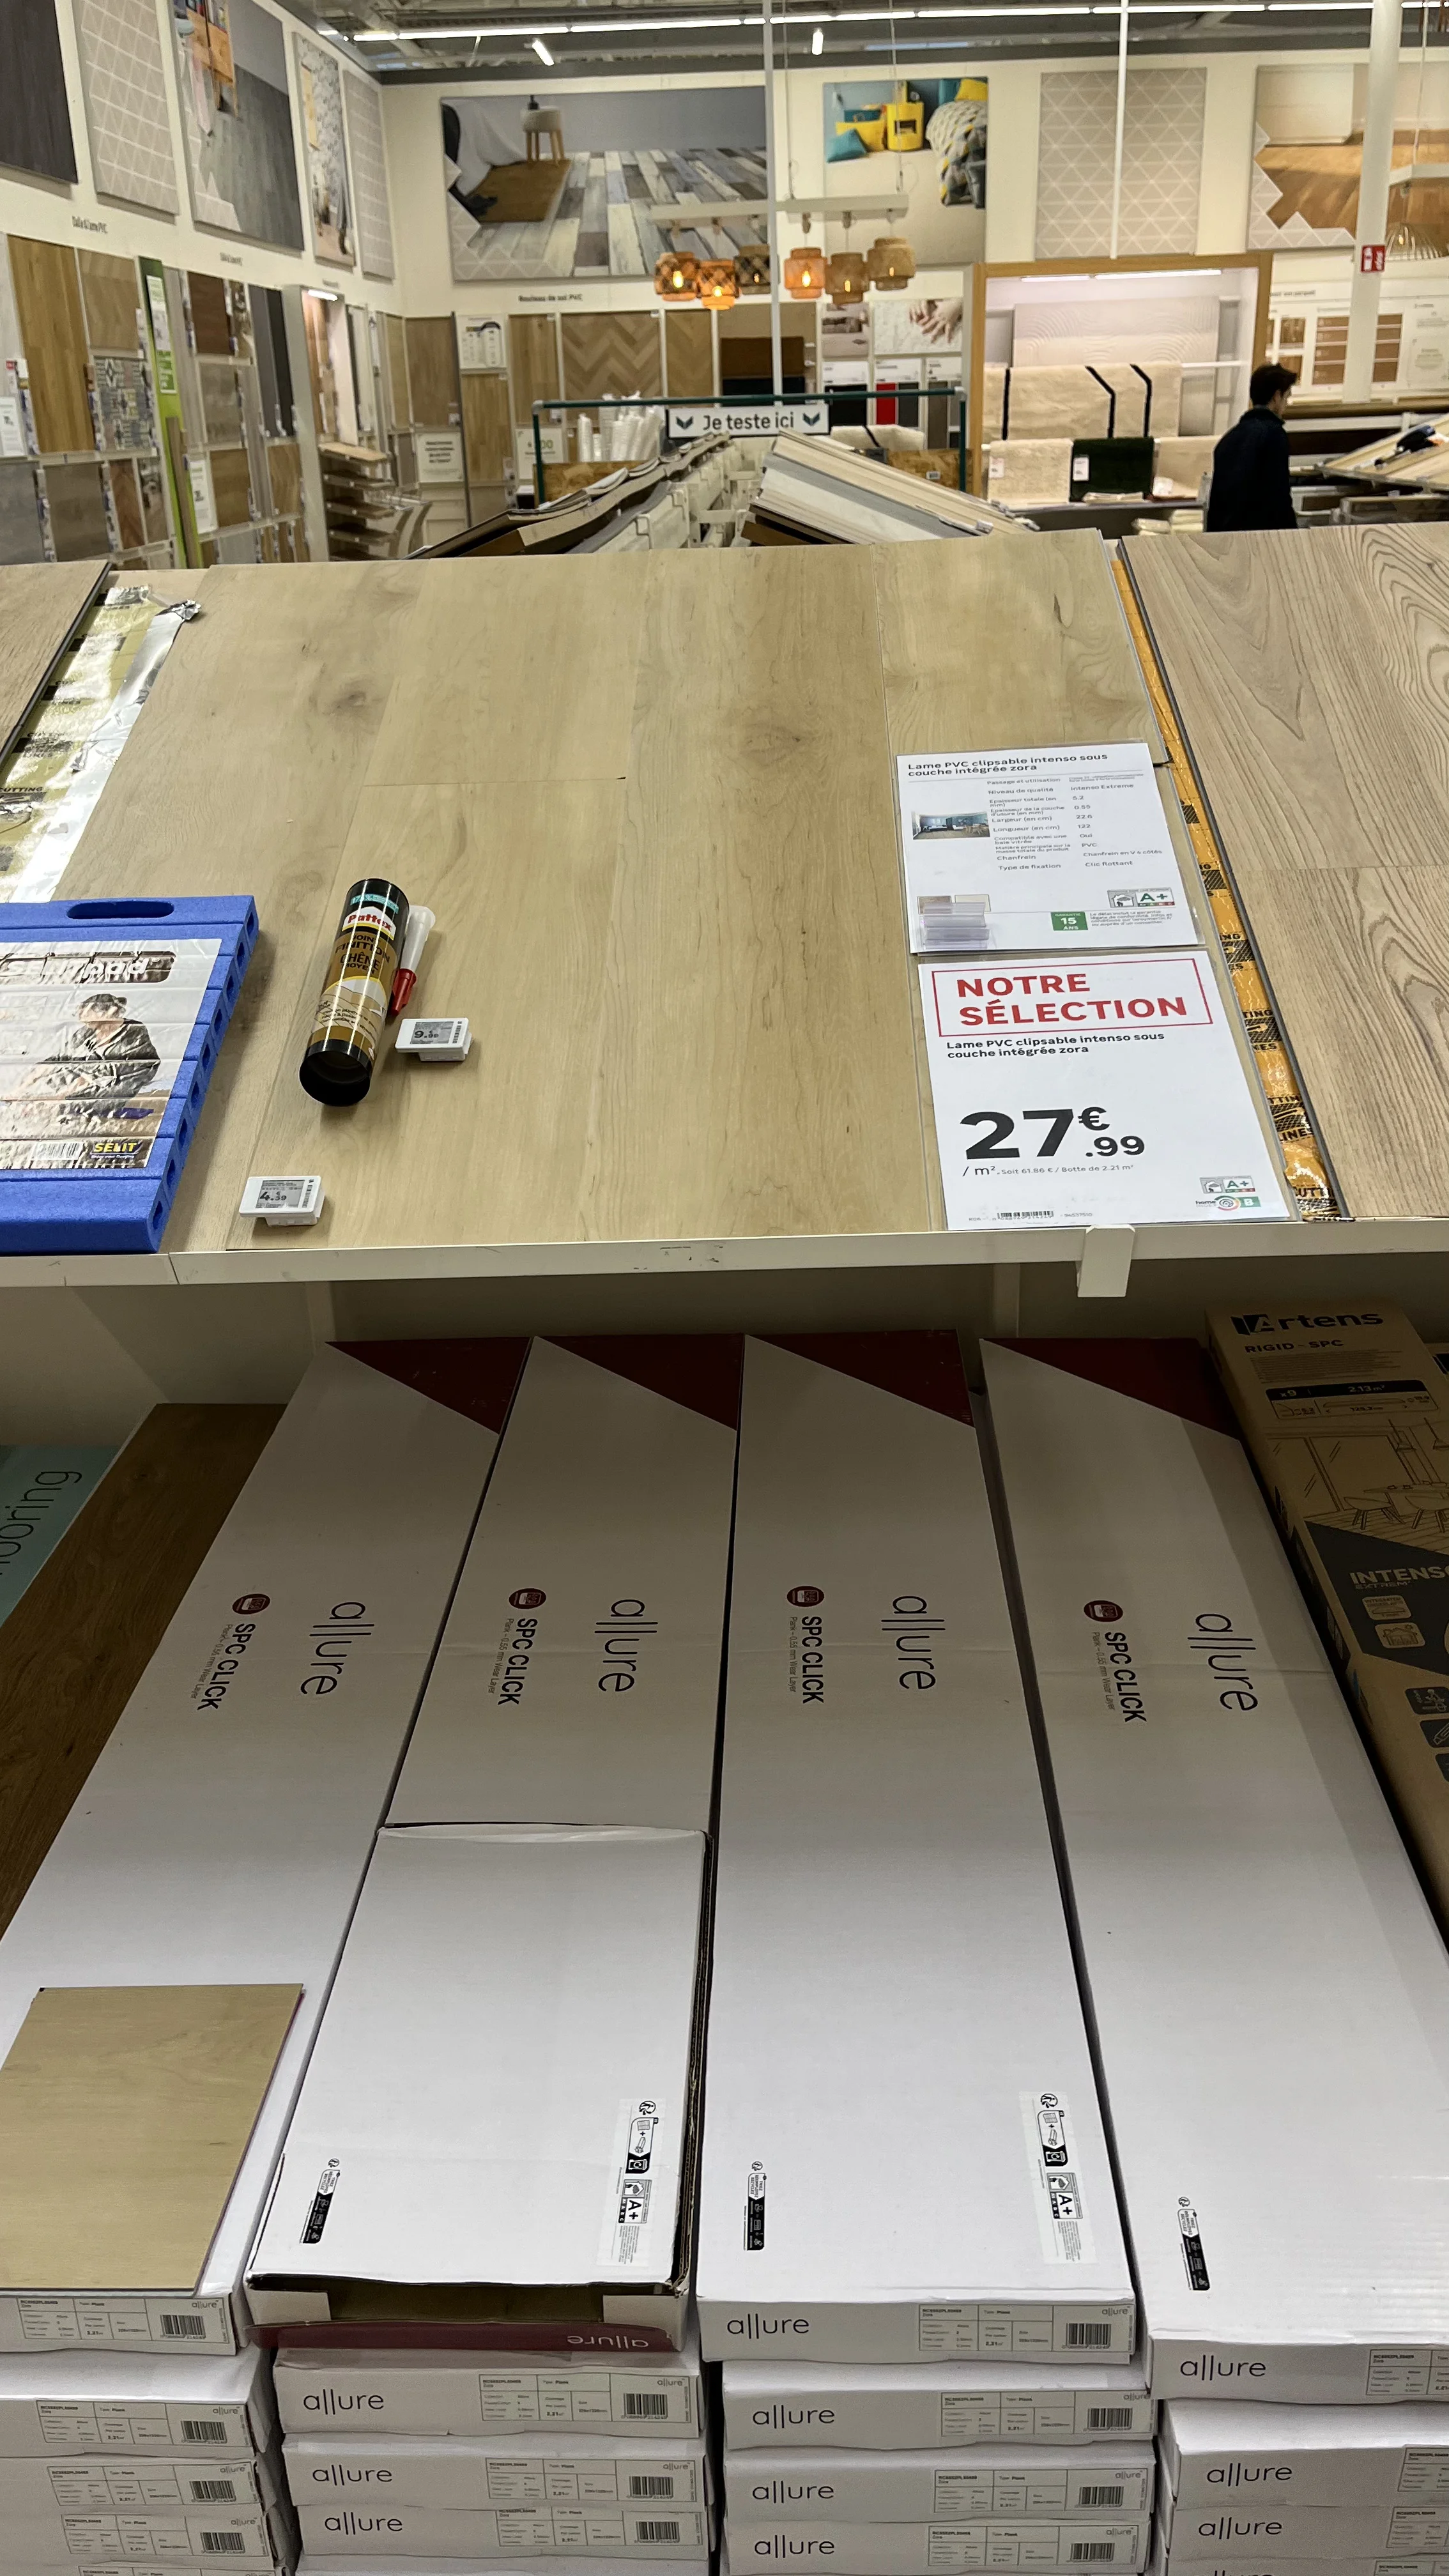
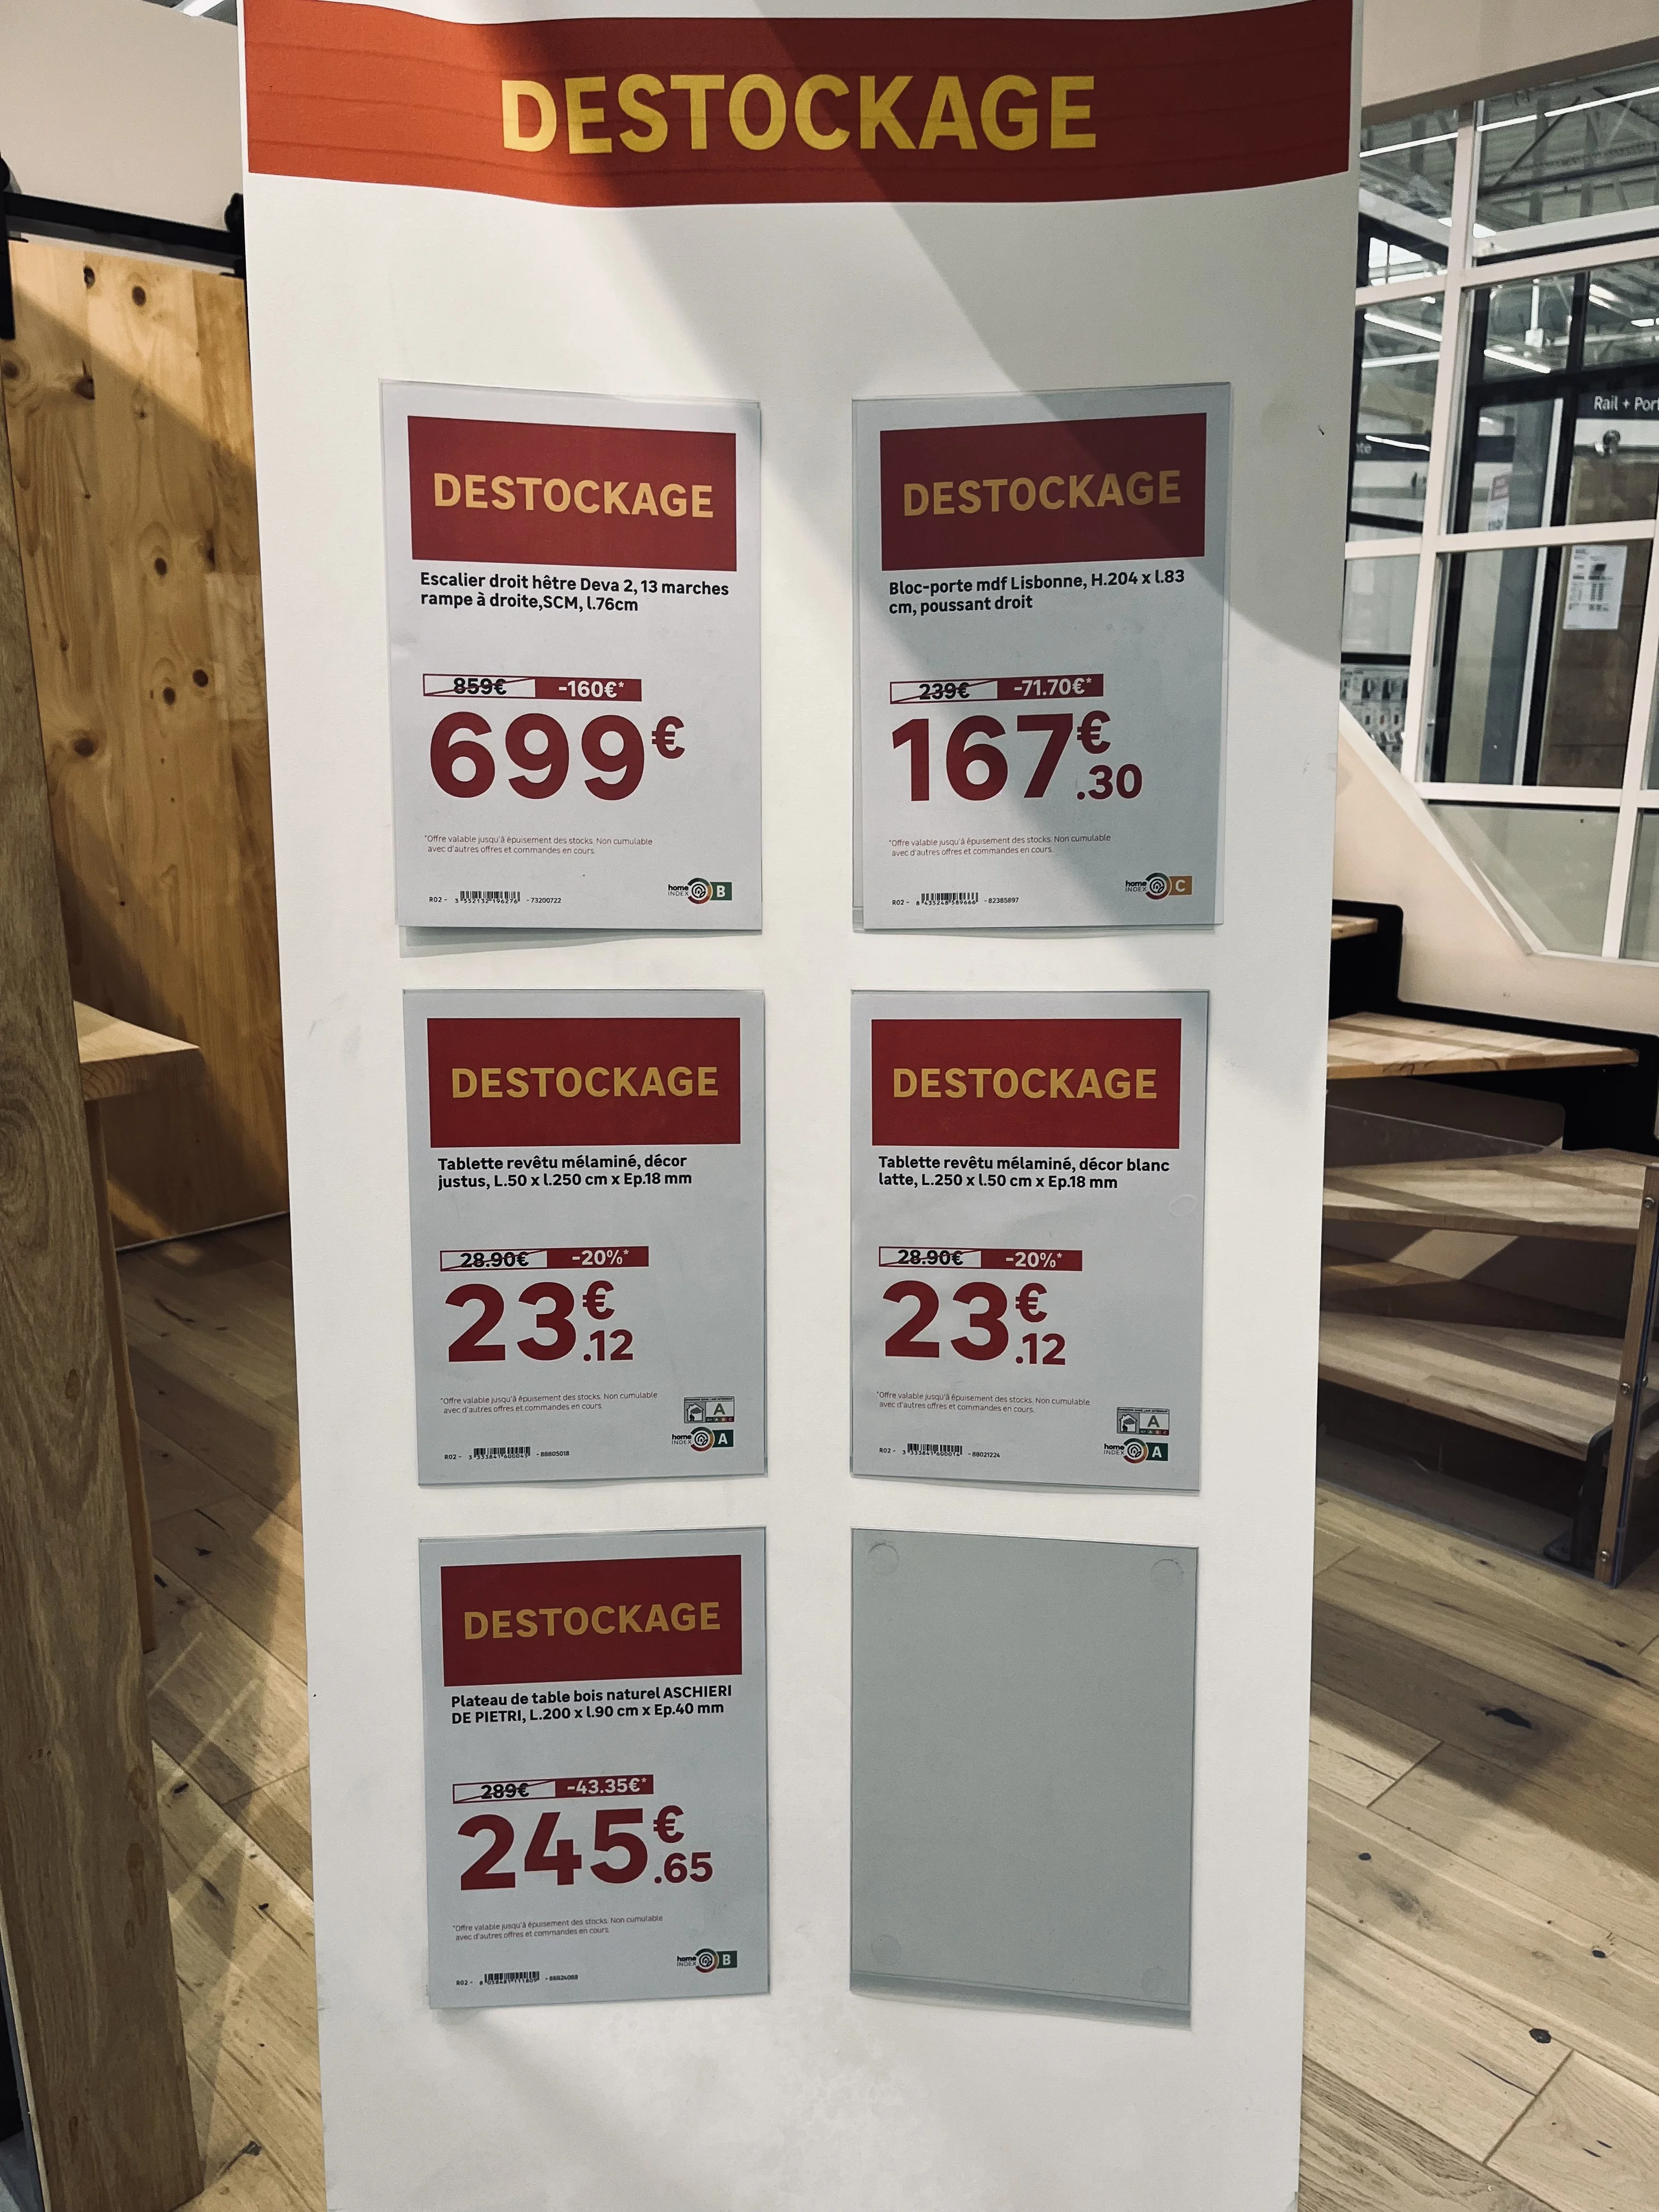
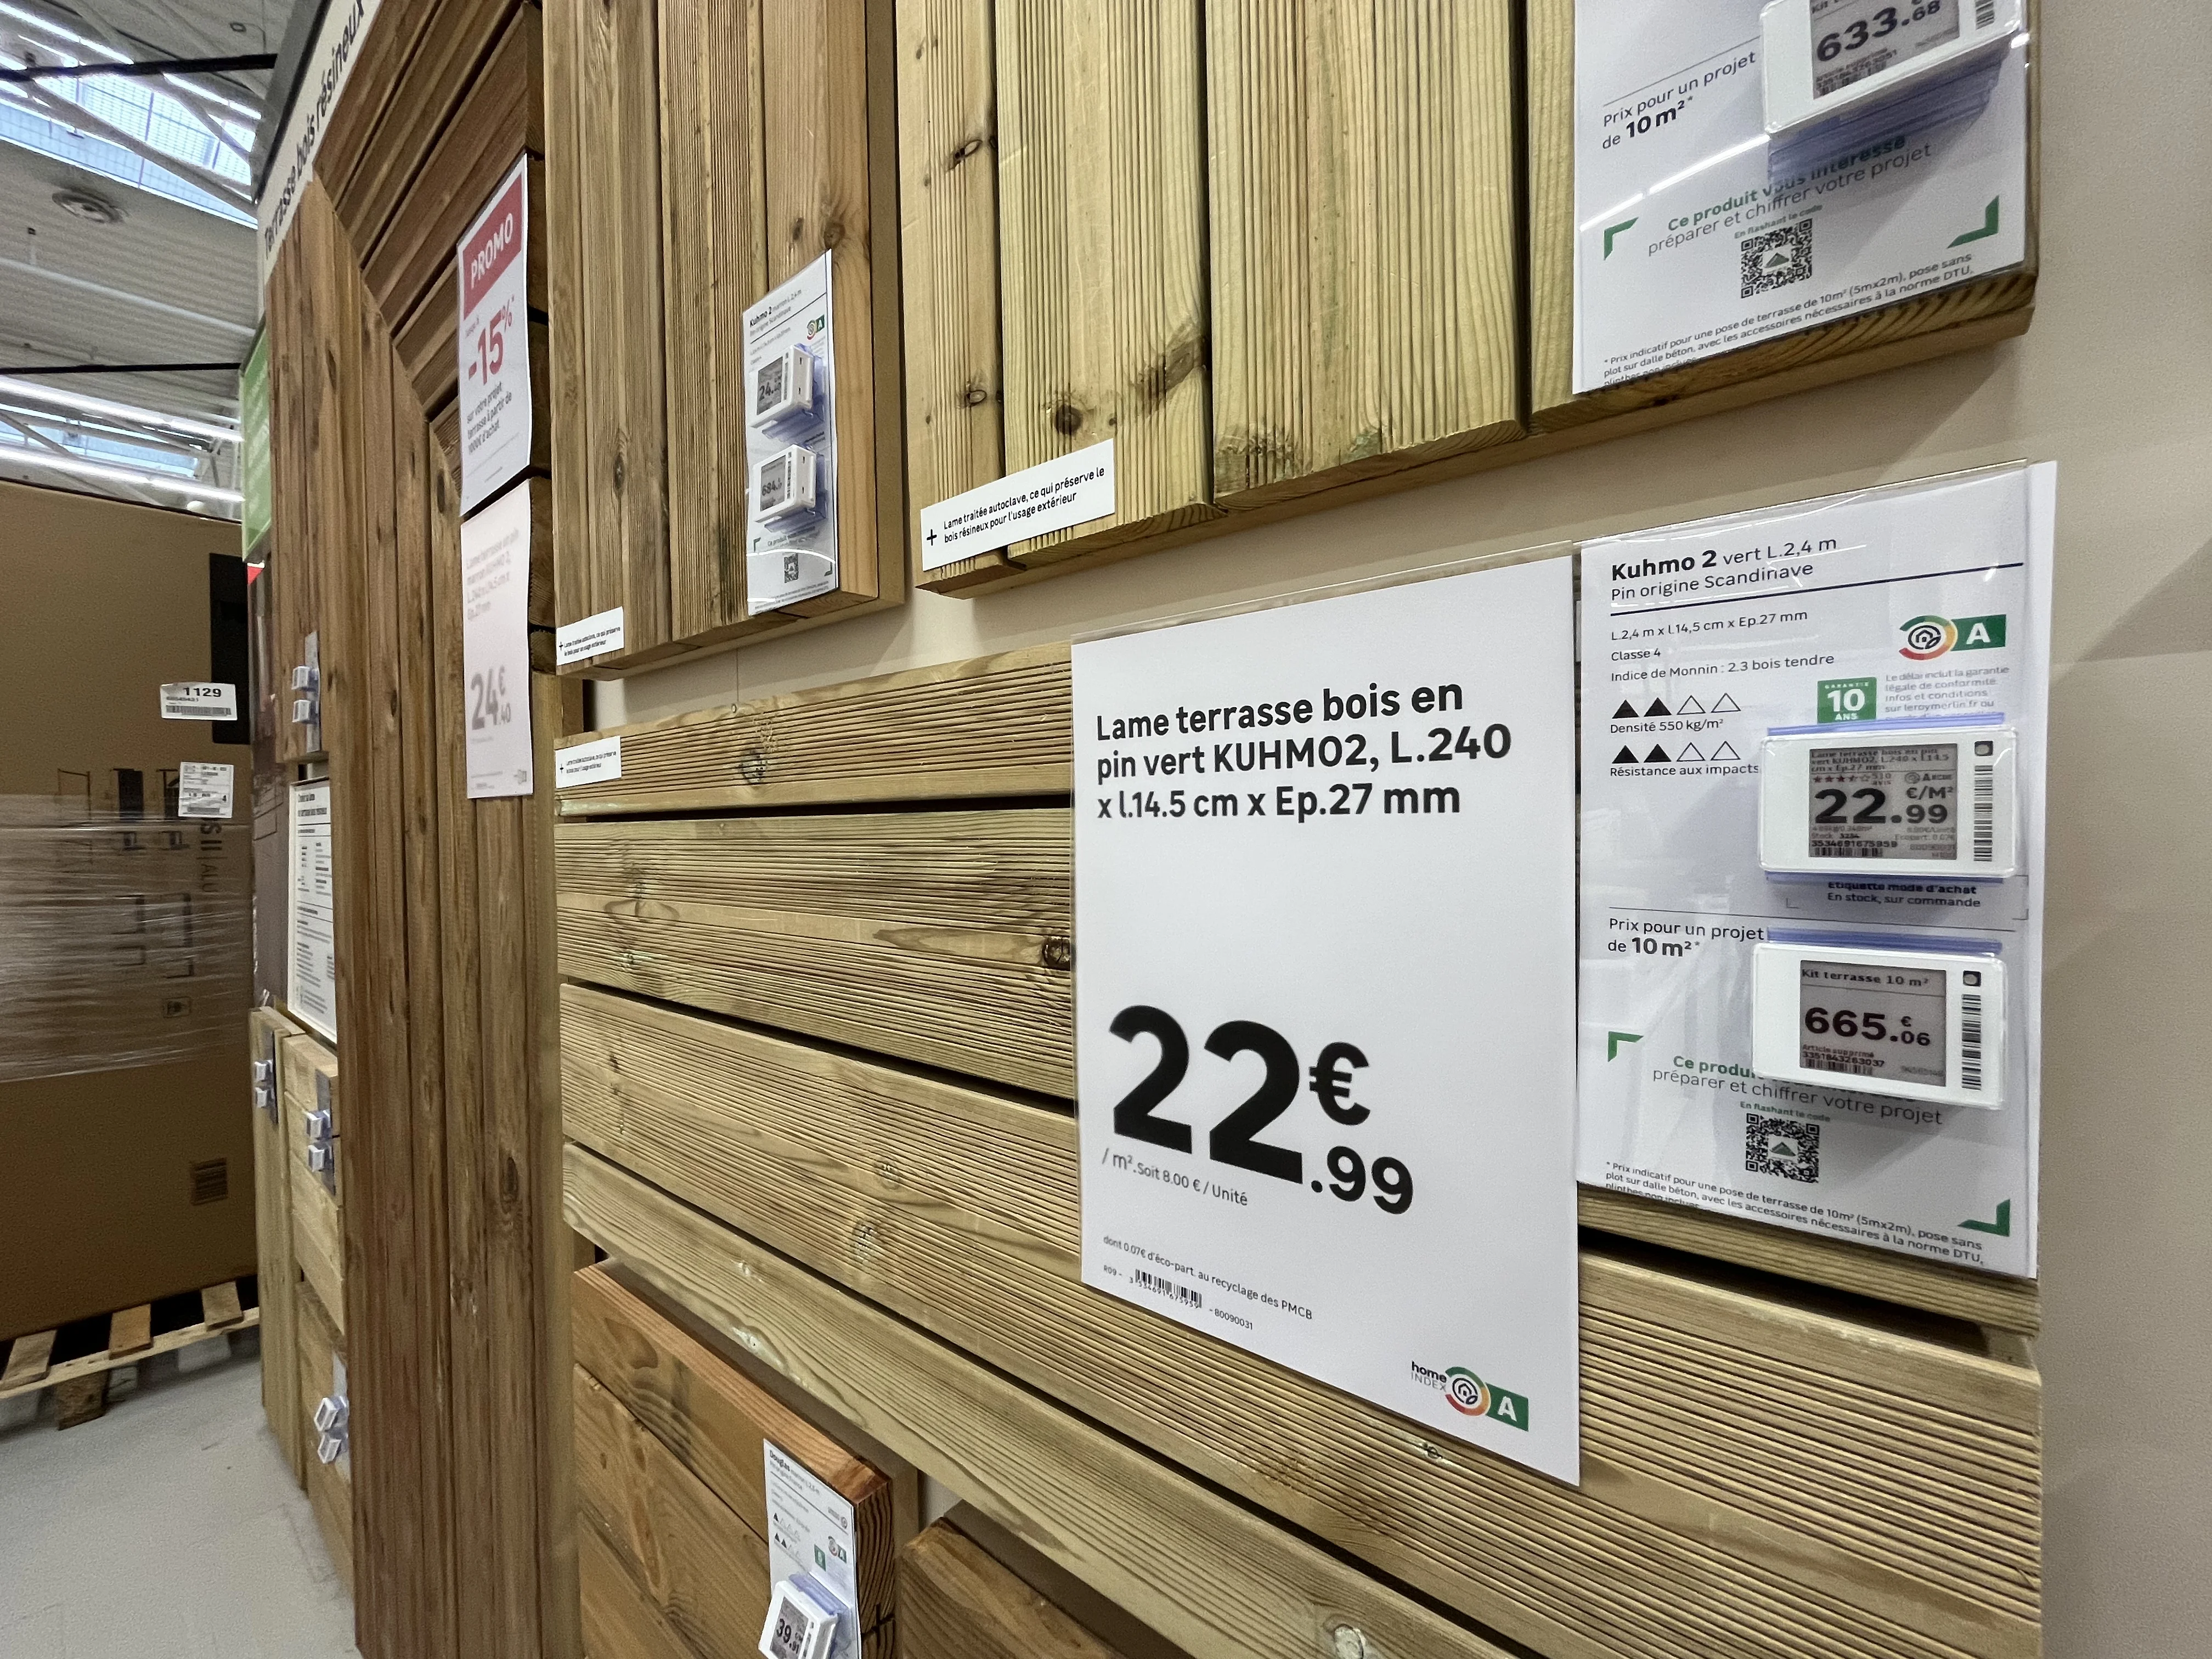
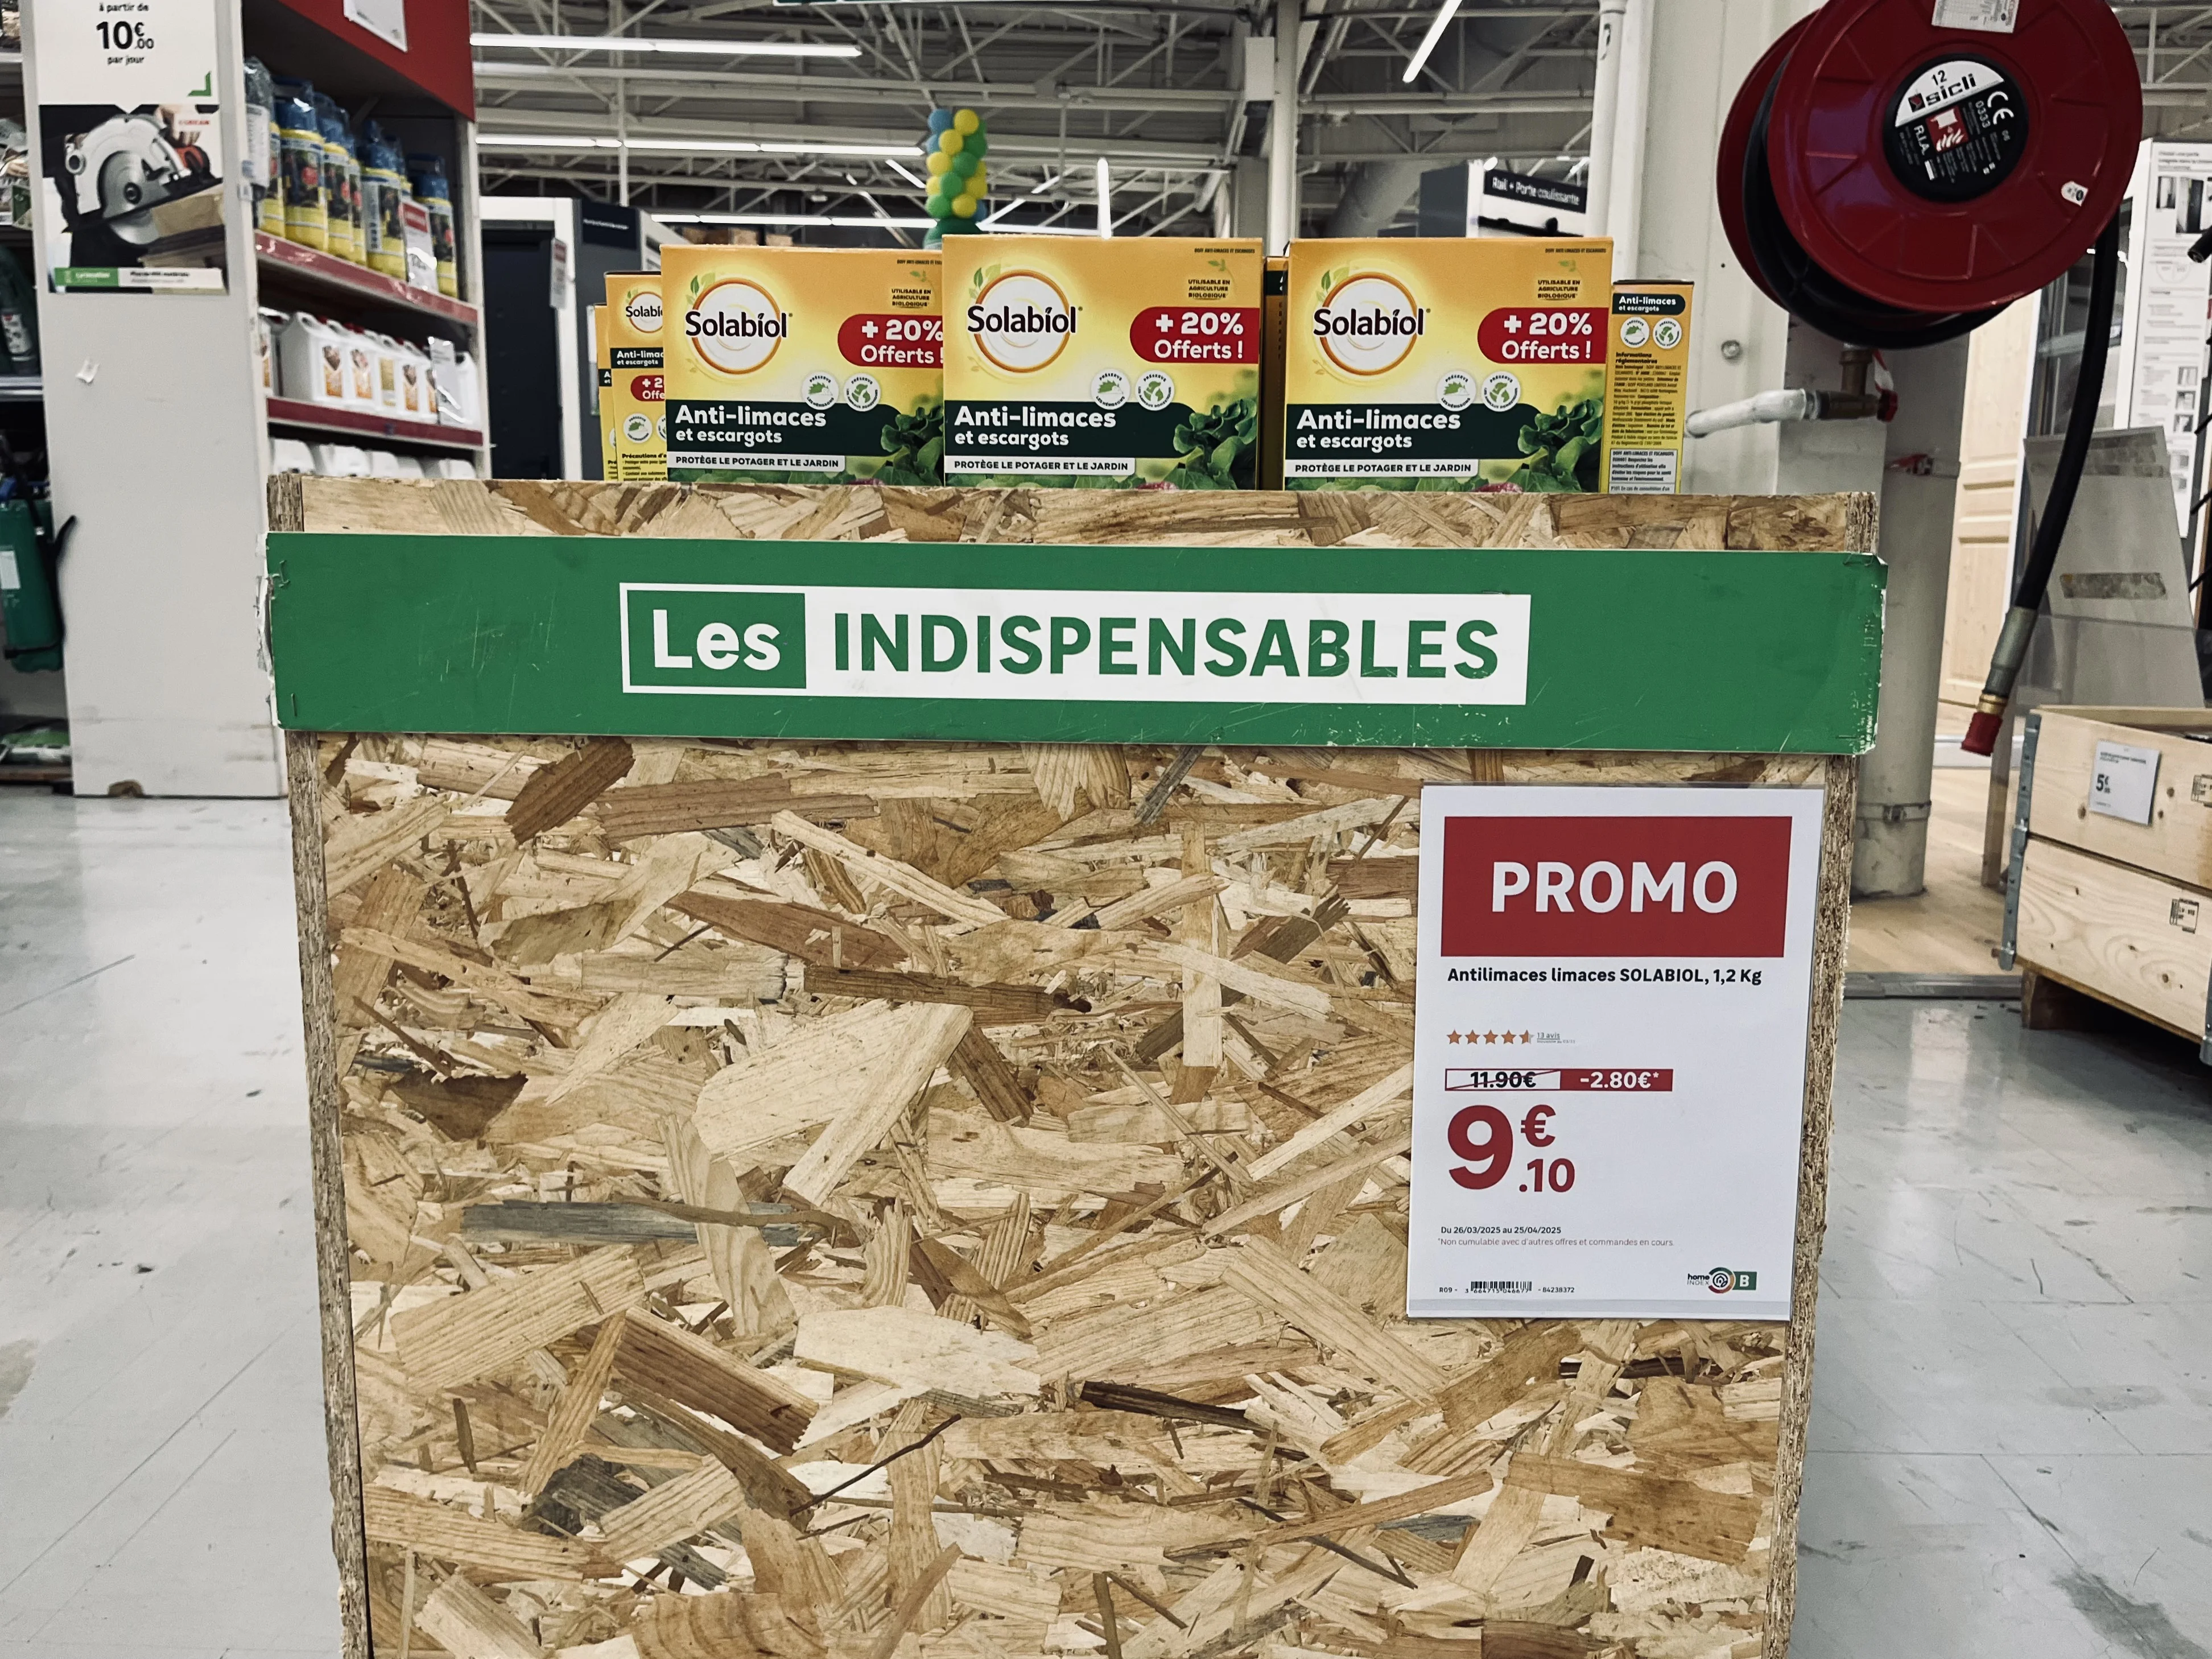
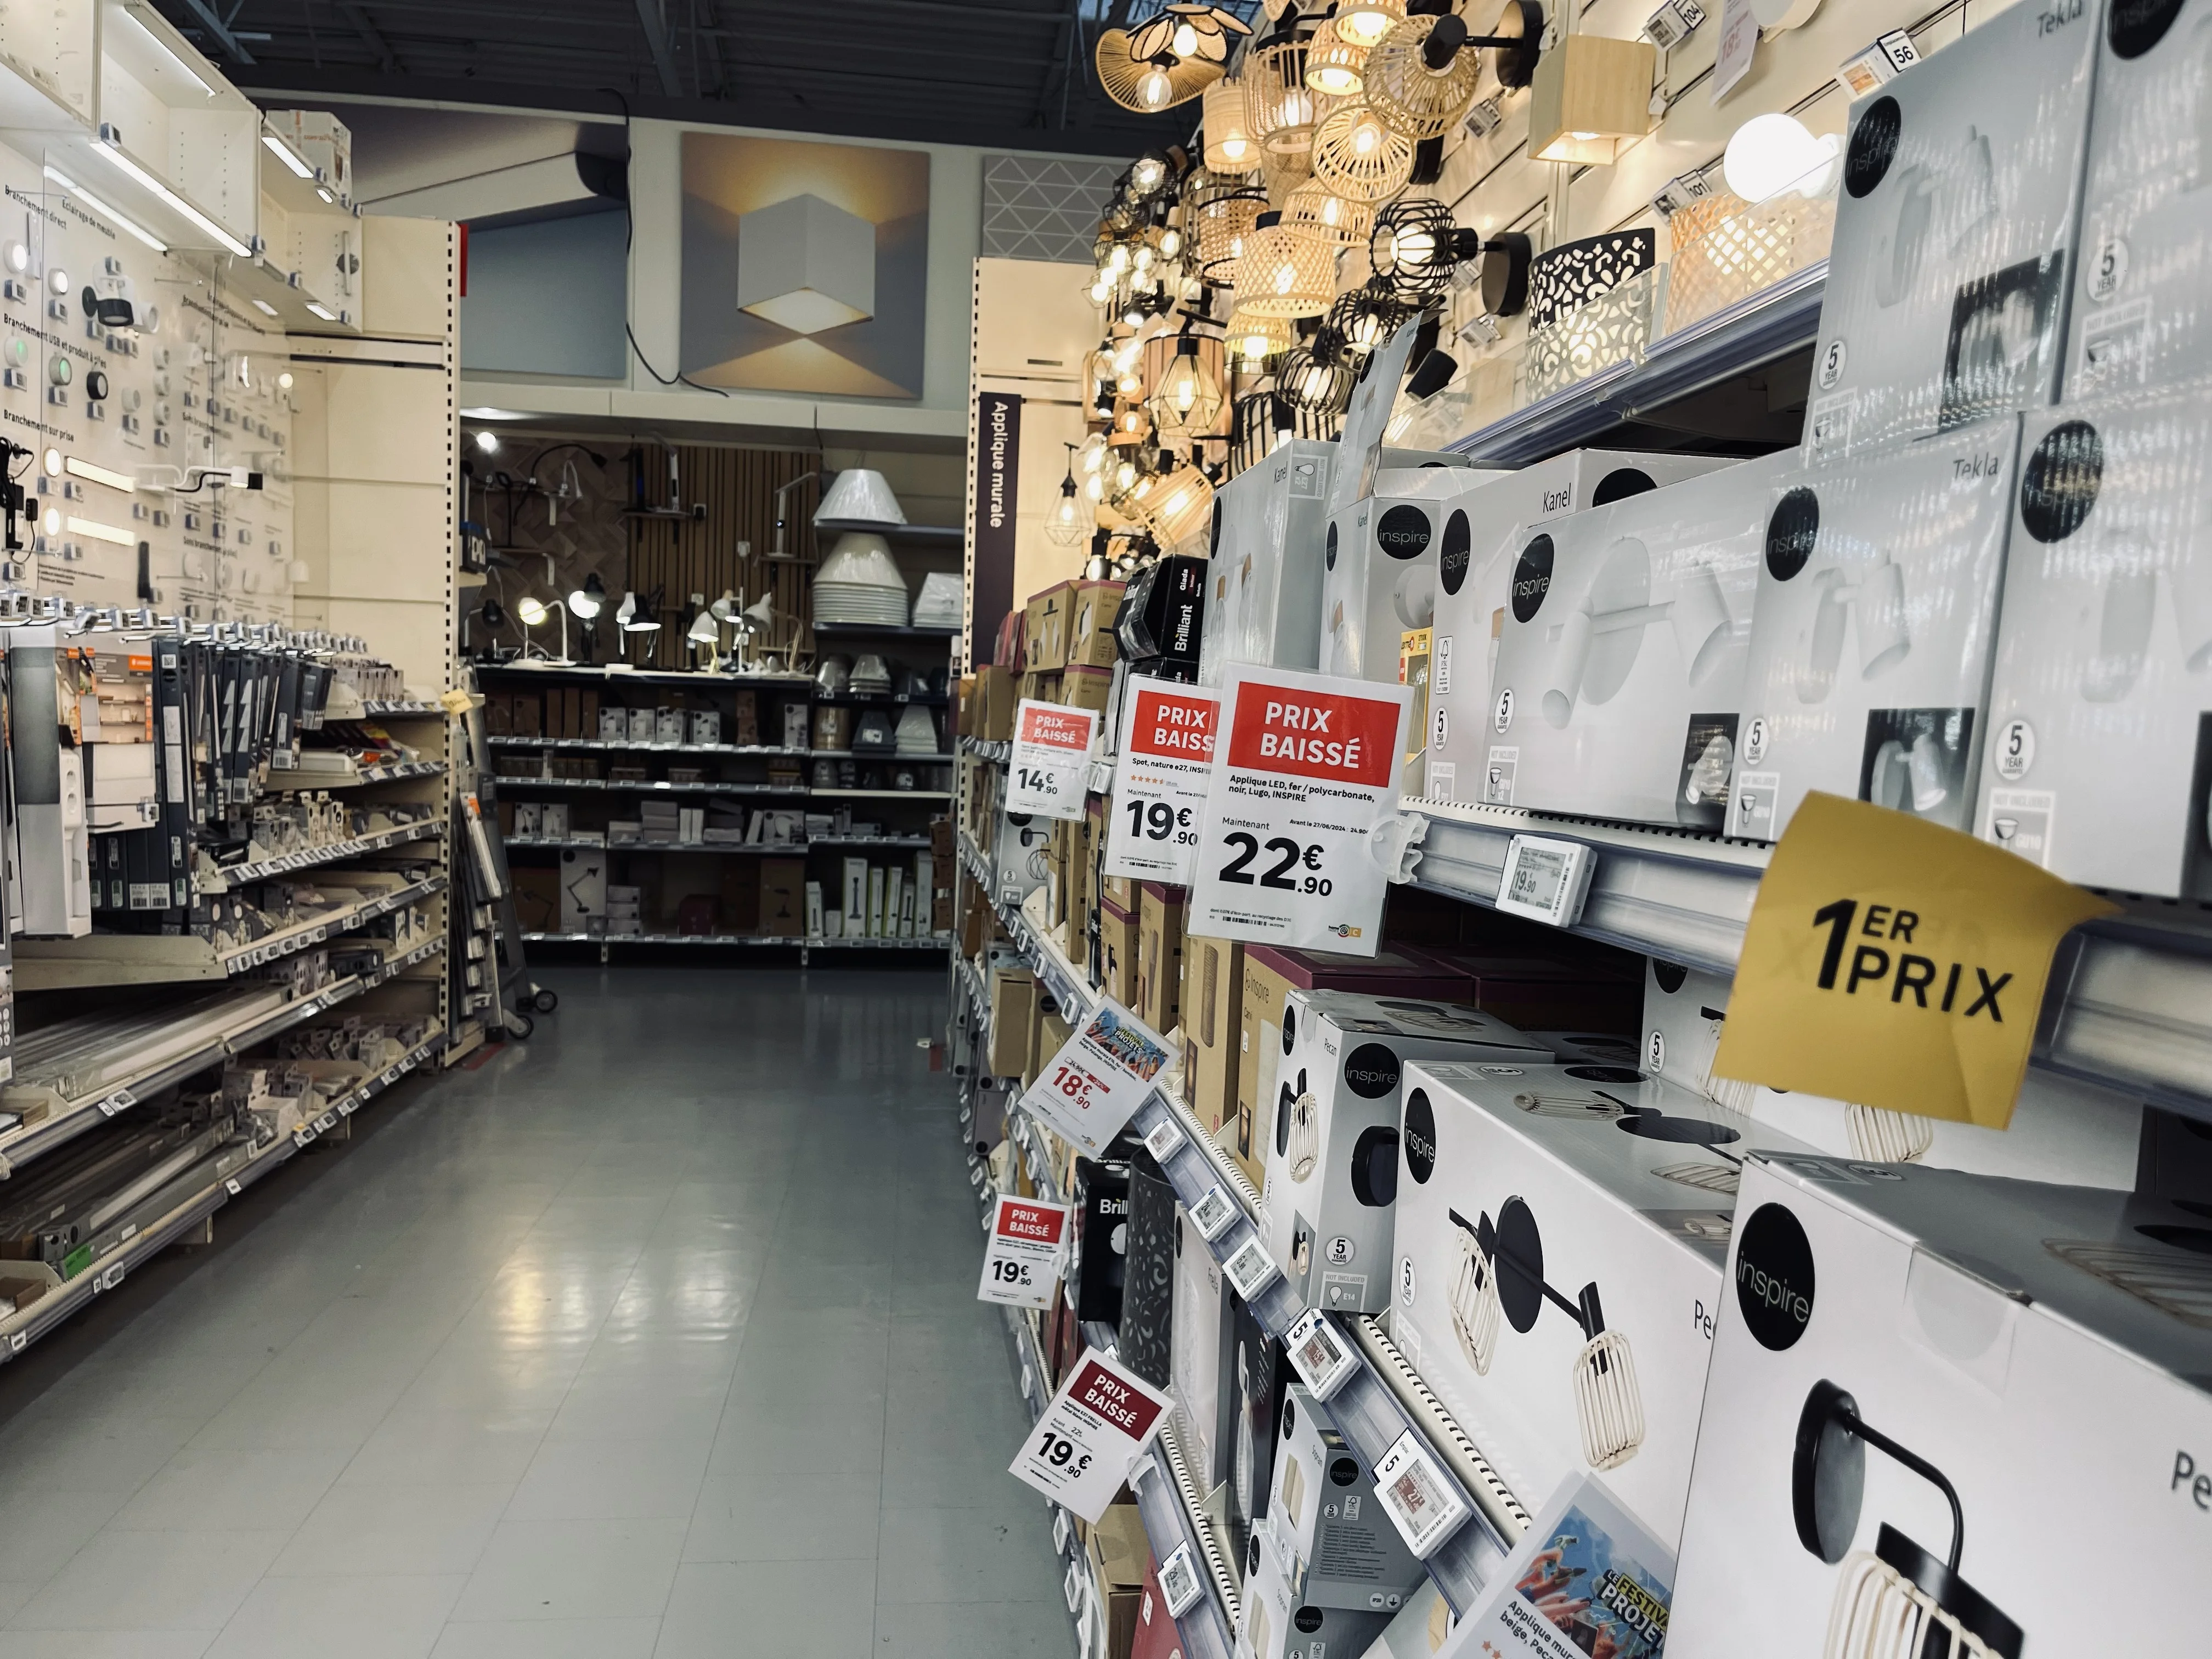
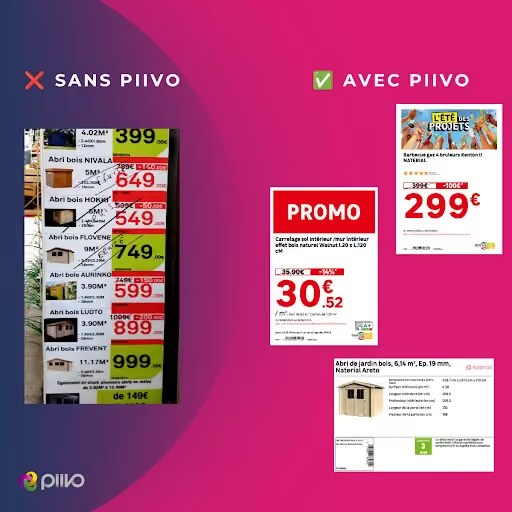
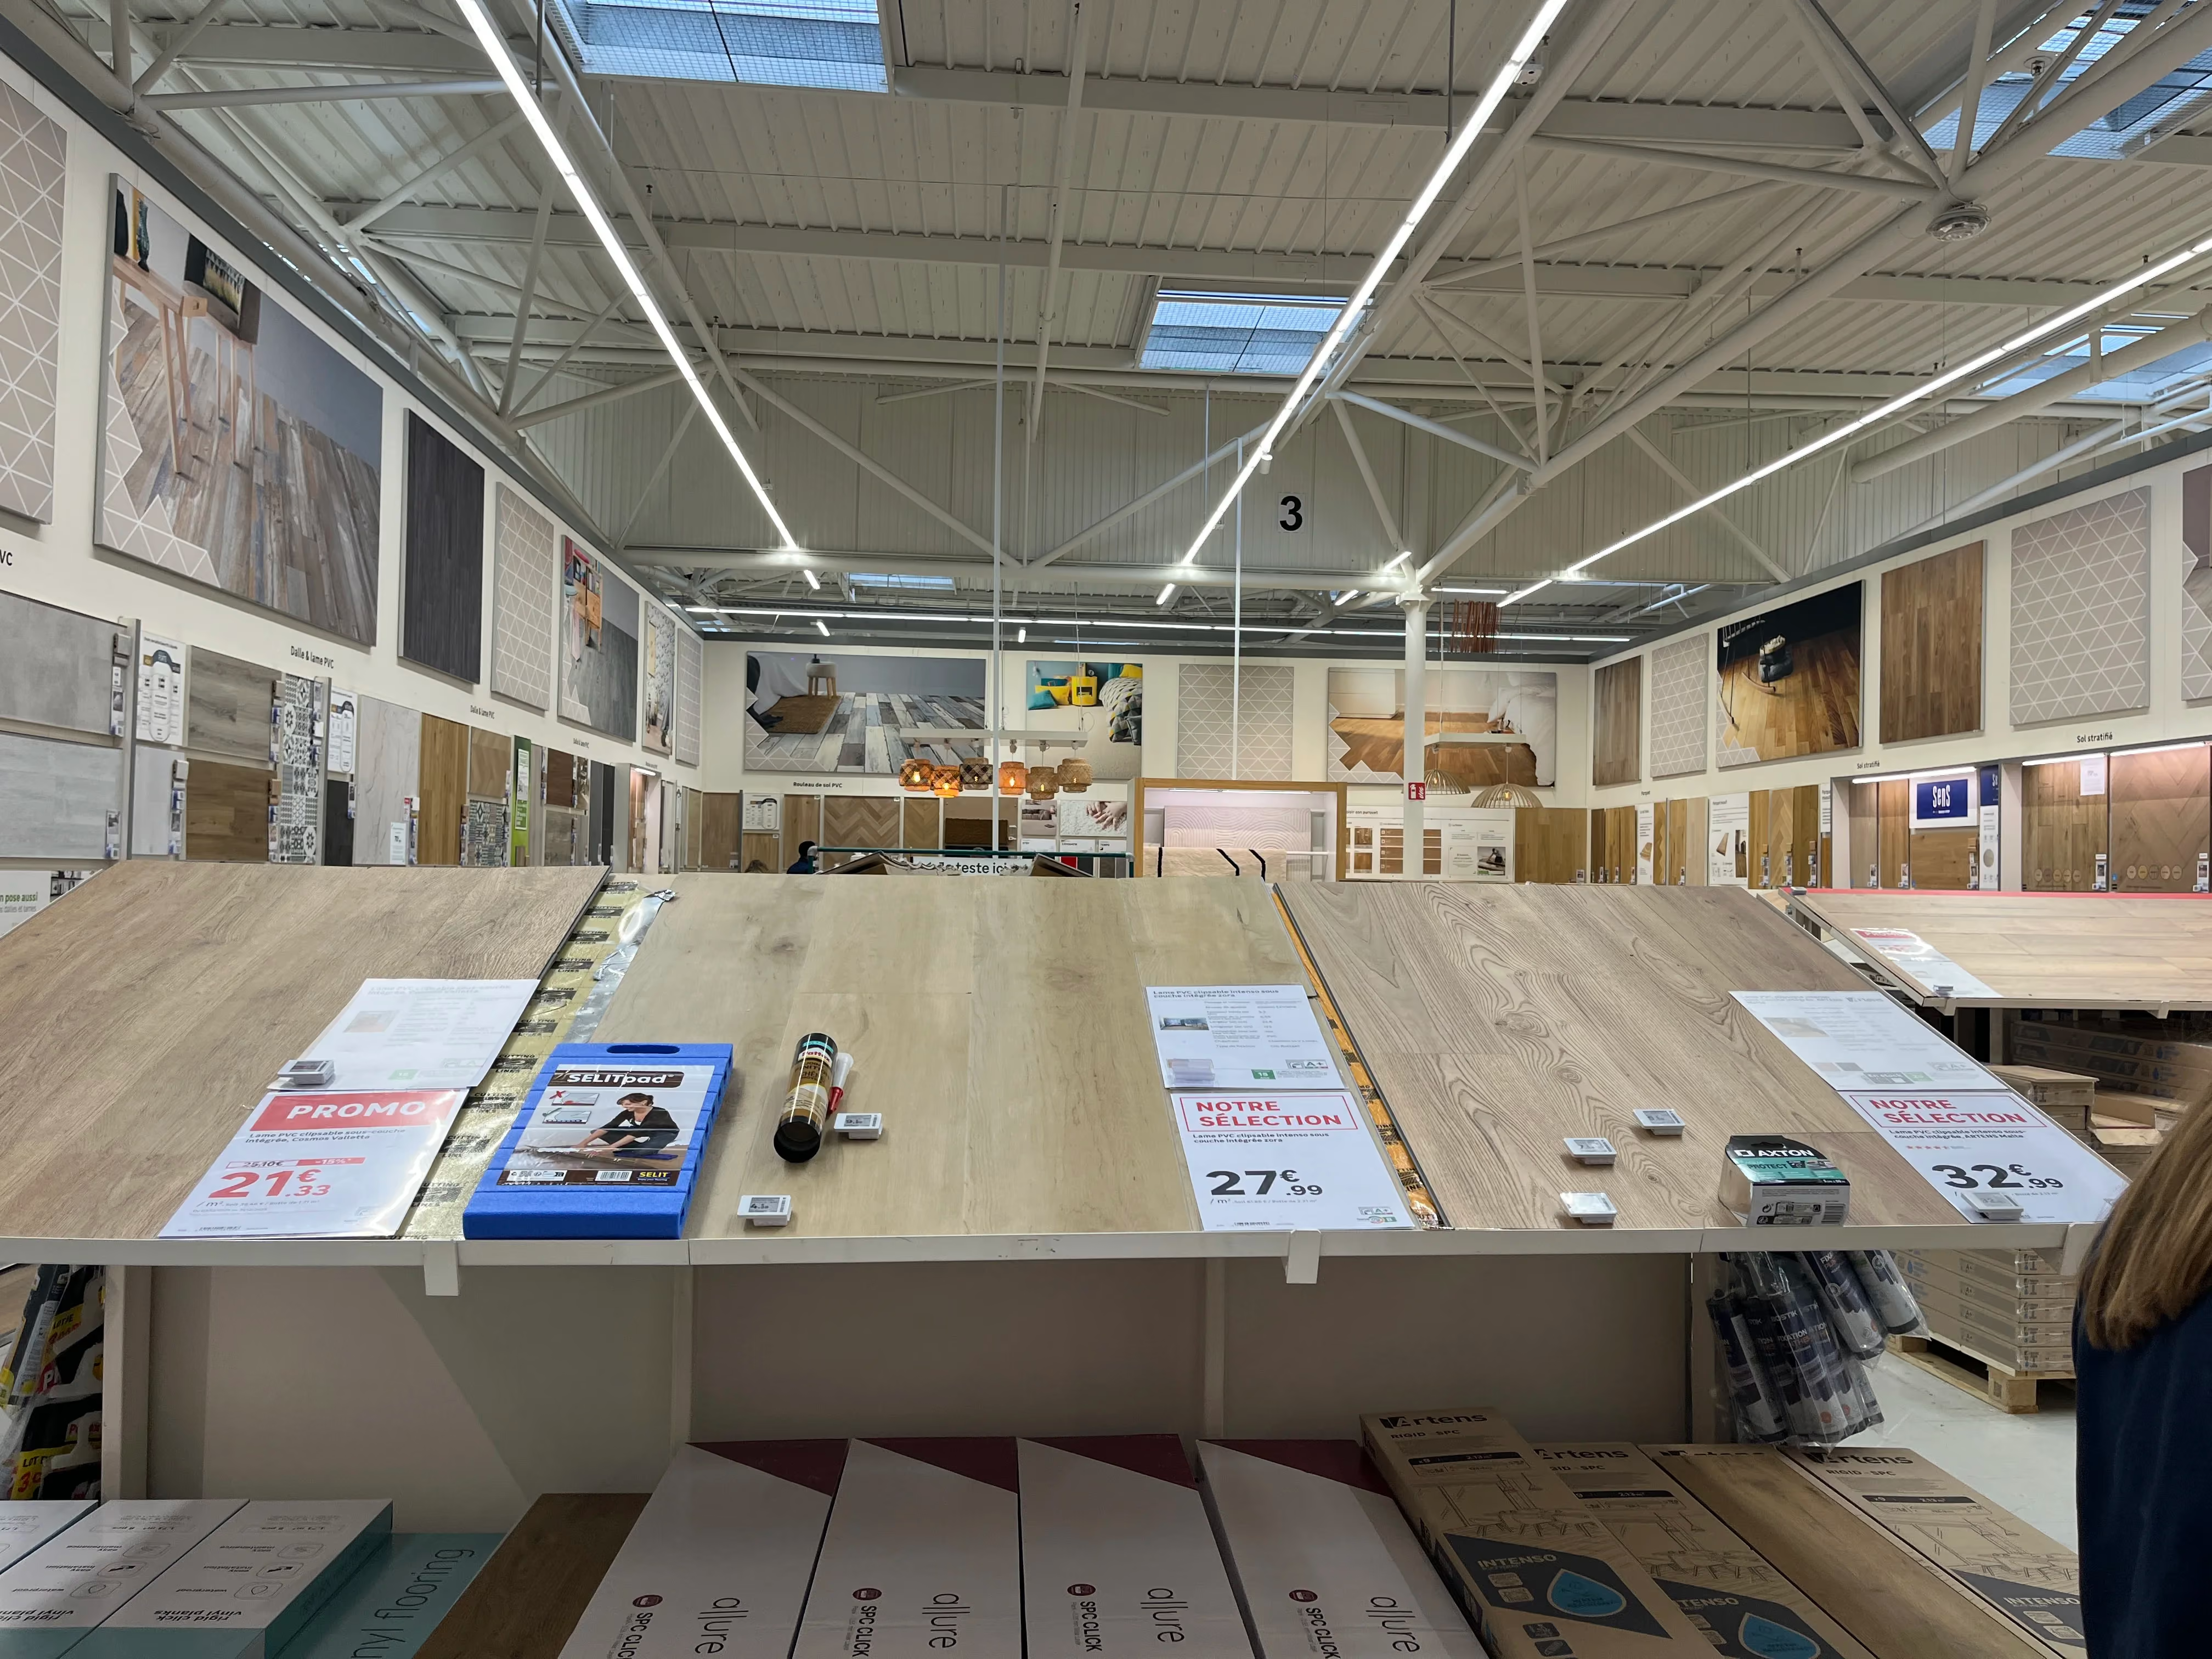
How can you ensure visual consistency across a retail chain?
Customers compare shelf prices with website prices, phone in hand. Discover the origins of product and price inconsistencies between retail stores and e-commerce, and learn how to avoid them by feeding all your channels from a single source of data.
How can you avoid price inconsistencies between your store and your e-commerce site? By ensuring that shelf labels and online product pages are generated from the same data sources: prices from the ERP, descriptions and specifications from the PIM, and visuals from the DAM. This eliminates manual re-entry between the two channels and triggers updates to in-store displays as soon as a price changes in the master system.
Before entering a store, most customers have already checked the brand's website. They know the price, the product reference, and sometimes even the in-store availability. Once they are standing in front of the product, they compare, phone in hand. If the shelf label doesn't match the website, the customer doesn't assume it's a technical glitch. They assume the brand is mistaken, or worse, trying to deceive them. Here is where these inconsistencies come from and how to avoid them for good.
Why customers immediately notice inconsistencies
The shopping journey is no longer one-sided. Customers spot a product online and come to see it in-store, or discover a product on the shelf and check its price on the website. They order online and pick up in-store. To them, there is only one brand, and therefore, there should be only one price. The e-commerce site has become the public showcase for product information. It serves as the customer's reference point. As soon as the shelf price deviates from it, the in-store display appears incorrect, even when the error originated elsewhere. The consequences go beyond the individual transaction: a dispute at the checkout, a discount given to appease the customer, or a customer losing trust in other displayed prices. Across a retail network, these repeated discrepancies eventually undermine the brand's consistency.
The most common inconsistencies between stores and websites
Discrepancies between the shelf and the web almost always take one of these five forms.
Inconsistency
What the customer sees
Usual cause
How to avoid it
Different price
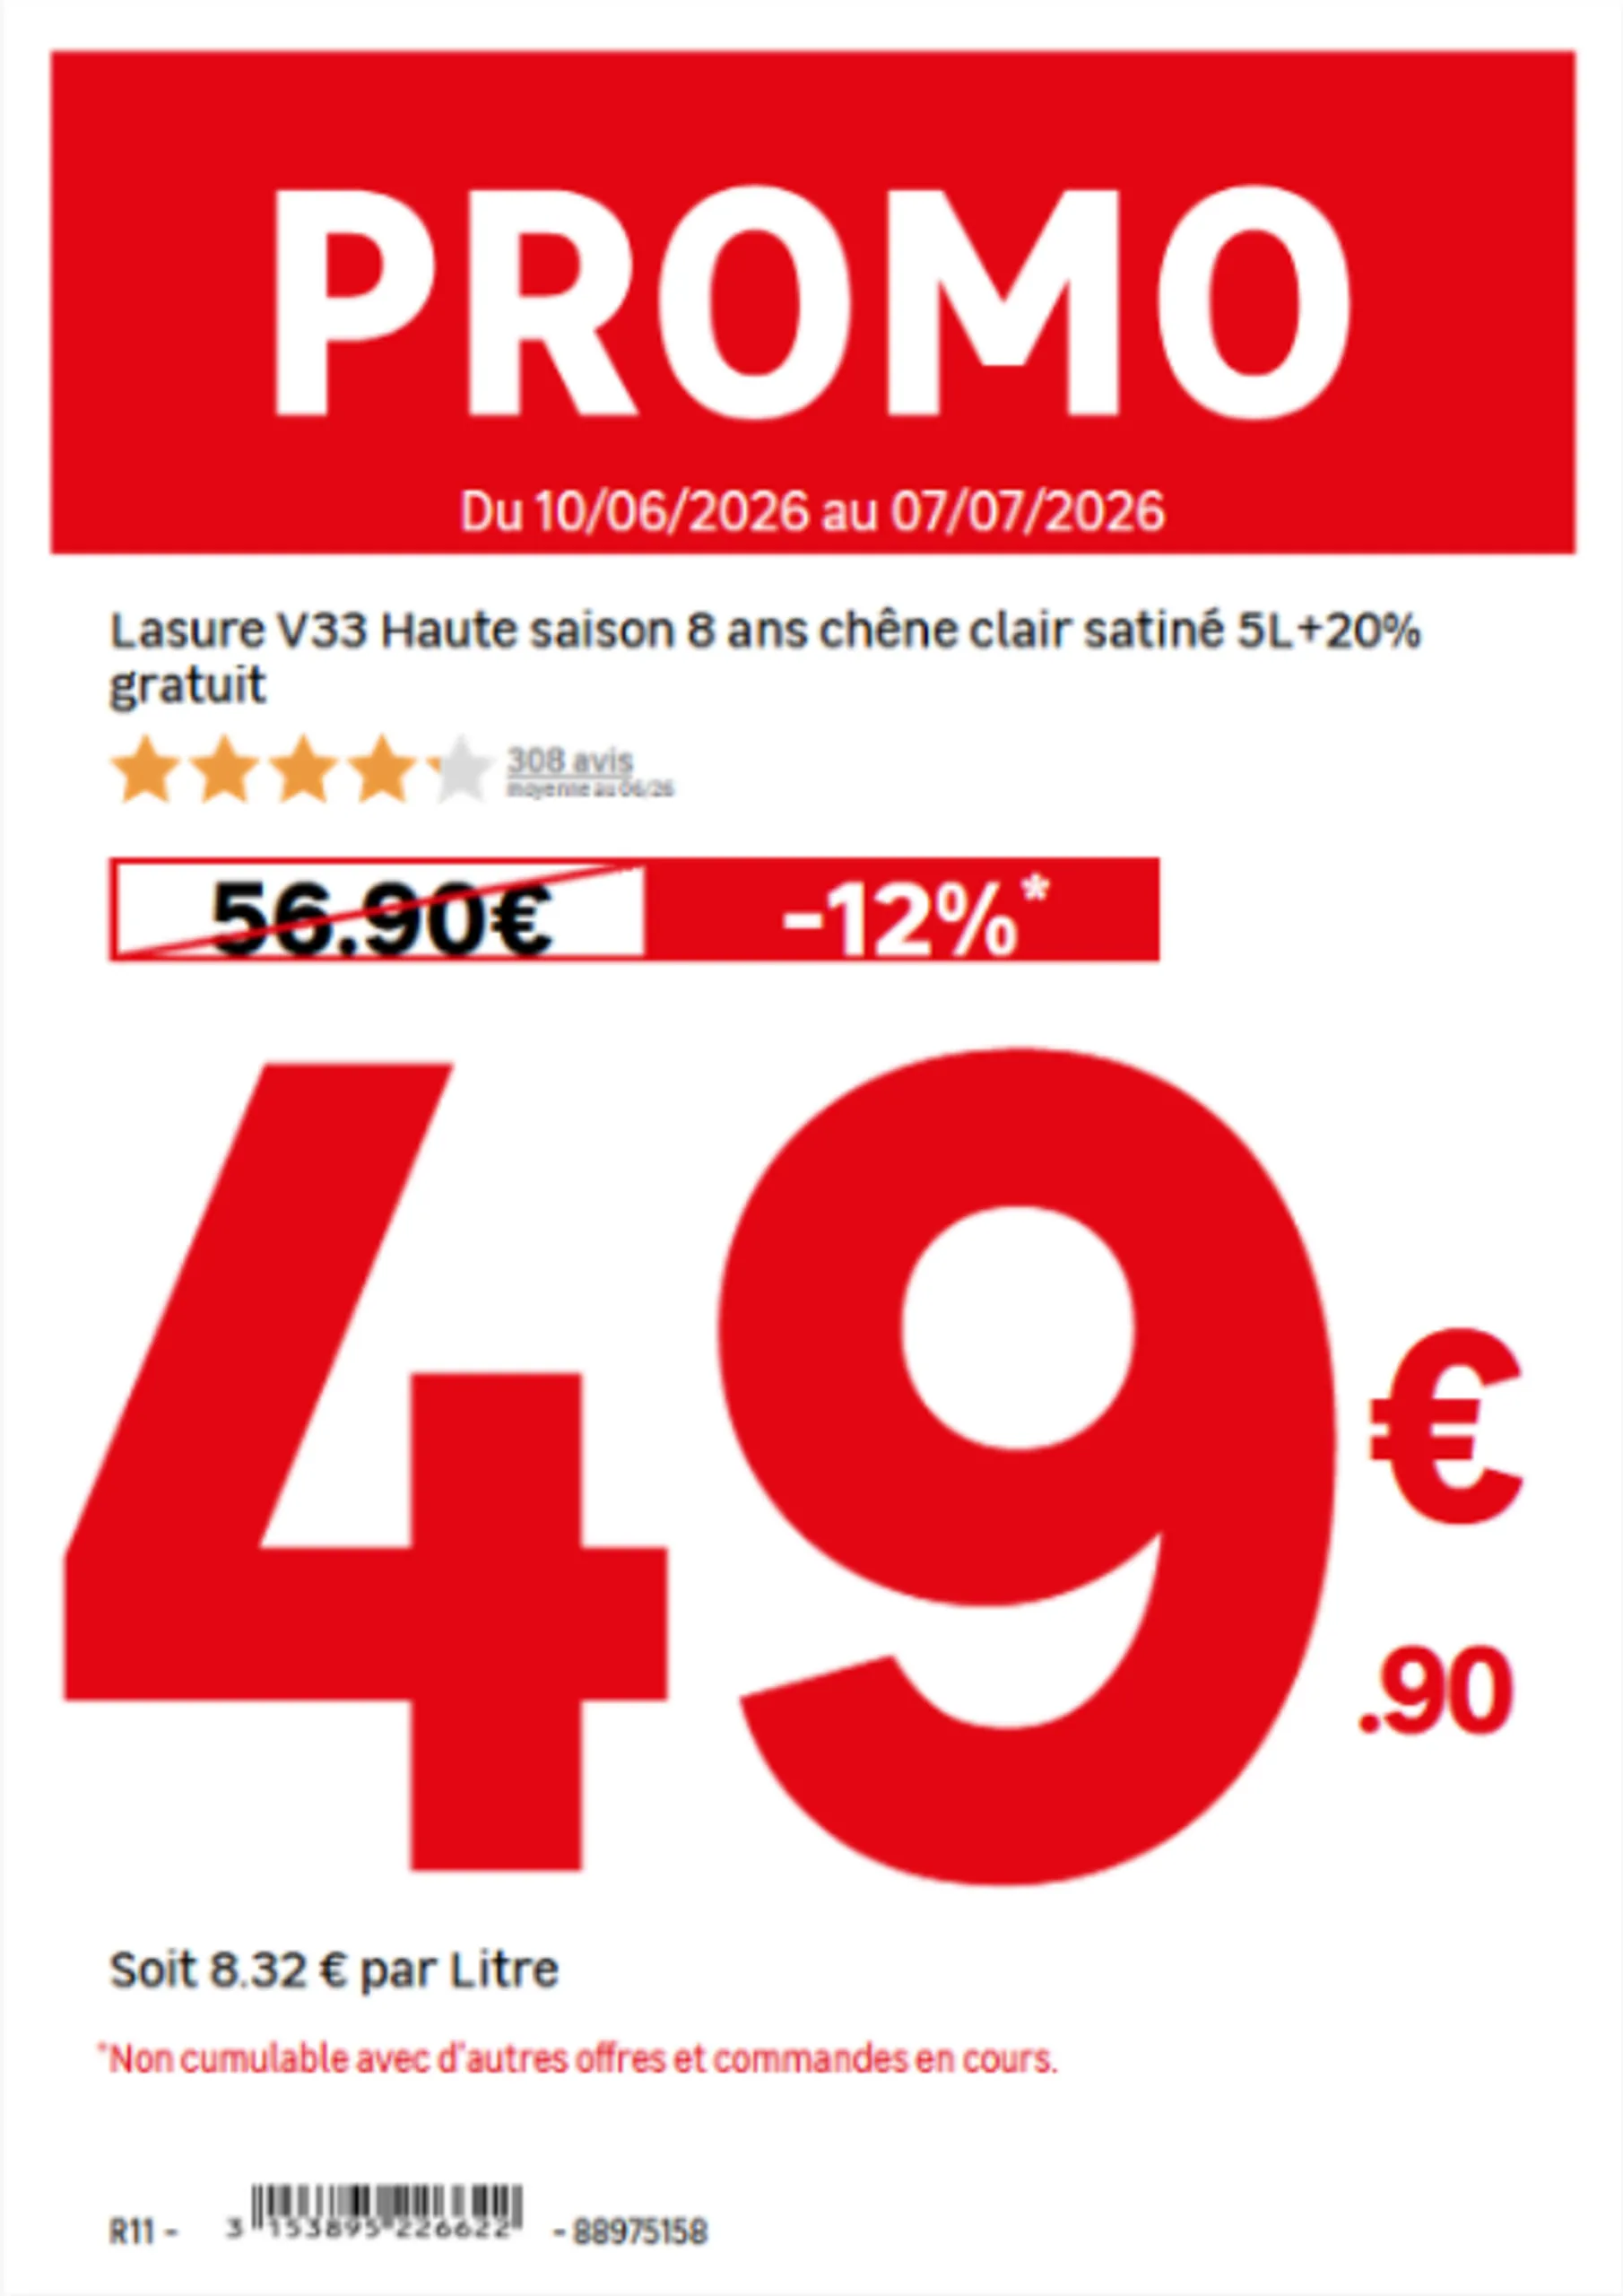
What the customer seesThe shelf price does not match the website
Usual causeSign created from an outdated file or re-keyed by hand
How to avoid itRead the price from the ERP when the sign is created
Expired promotion
What the customer seesThe offer has ended online but is still displayed in store
Usual causeEnd date not carried over to the sign
How to avoid itUse the campaign's validity dates
Inconsistent was-price
What the customer seesThe reference price differs from one channel to another
Usual causePrior price calculated by hand, separately
How to avoid itA central calculation based on price history
Product name or specifications
What the customer seesThe name, dimensions or power rating differ
Usual causeDescription copied outside the PIM
How to avoid itRead the product name and specifications from the PIM
Missing image or mention
What the customer seesDifferent photo, missing regulatory pictogram
Usual causeImages stored locally, mentions added by hand
How to avoid itImages from the DAM, mentions based on product family
The most common situations, for guidance only. Exact causes vary with each retailer's organisation.
The common thread in all these situations is that the information is correct somewhere in the brand's systems. It is the in-store display that fails to reflect it, or reflects it too late.
The common cause: two channels, two data streams
In many retail chains, the website and the store do not pull their information from the same place. The e-commerce site generally reads its data directly from central systems: prices from the ERP, product sheets from the PIM, and images from the DAM. In-store displays, however, are often produced separately. This might involve a file exported the day before, a label template filled out by hand, or a description copied from a catalog. These two circuits operate in parallel and eventually diverge. A price change during the day, an extended promotion, or a replaced product reference is all it takes for the site to be up to date while the shelf is not. Manual re-entry introduces its own errors: transposed digits, different units, or forgotten details. Trying to fix these gaps by simply checking labels more often doesn't solve the problem. Both channels must read from the same data source.
The principle: a single source of truth for all channels
Consistency between physical stores and e-commerce relies on a simple rule: every piece of information is pulled from its authoritative system, and all channels—whether online or on the shelf—are fed by that same source.
Learn more
Managing your network's signage: //the 2026 best practices guide.//
Do you manage an integrated or franchise network? Discover our methodology for turning your signage into a driver of operational excellence. 25 pages of expertise, benchmarks, and practical checklists.
Oops! Something went wrong while submitting the form.
Free resource
High-quality PDF format
Certified retail expertise
Frequently asked questions
Frequently asked questions about store and e-commerce consistency
Pourquoi le prix en magasin est-il parfois différent du prix sur internet ?
Le plus souvent, parce que l’affiche en rayon a été créée à partir d’une donnée plus ancienne ou ressaisie à la main, alors que le site lit directement le prix à jour dans les systèmes de l’enseigne.
Comment synchroniser les prix entre le magasin et le site e-commerce ?
En alimentant l’affichage magasin et le site à partir des mêmes sources, principalement l’ERP pour le prix, et en déclenchant la mise à jour des supports en rayon dès qu’un prix change.
Quelles données faut-il connecter pour un affichage cohérent ?
Le prix et les promotions depuis l’ERP, la désignation et les caractéristiques depuis le PIM, les visuels depuis le DAM, complétés par la caisse et l’offre publiée sur le site.
Que dit la réglementation sur les prix barrés ?
Depuis la directive européenne dite « Omnibus », une annonce de réduction doit indiquer le prix antérieur, soit le prix le plus bas pratiqué au cours des 30 jours précédents.
Les magasins peuvent-ils encore créer leurs propres affiches ?
Oui. Ils les créent à partir des modèles et des données de l’enseigne, avec des droits de modification définis par le siège.
In-store signage: the complete guide for retail networks
Posters, shelf labels, shelf talkers: in-store signage is the final link between a retailer and its customer. Discover what makes signage effective, the mistakes seen most often on the shop floor, and how a network can keep every display accurate and consistent at scale.
Read the article
00
min read
What is in-store signage? In-store signage encompasses all the materials that inform and guide customers on the shelf: posters, price tags, shelf talkers, end-cap displays, banners, and electronic shelf labels. Successful signage is compliant with brand guidelines and regulations, features up-to-date pricing and product data, is error-free, and maintains impeccable graphic quality.
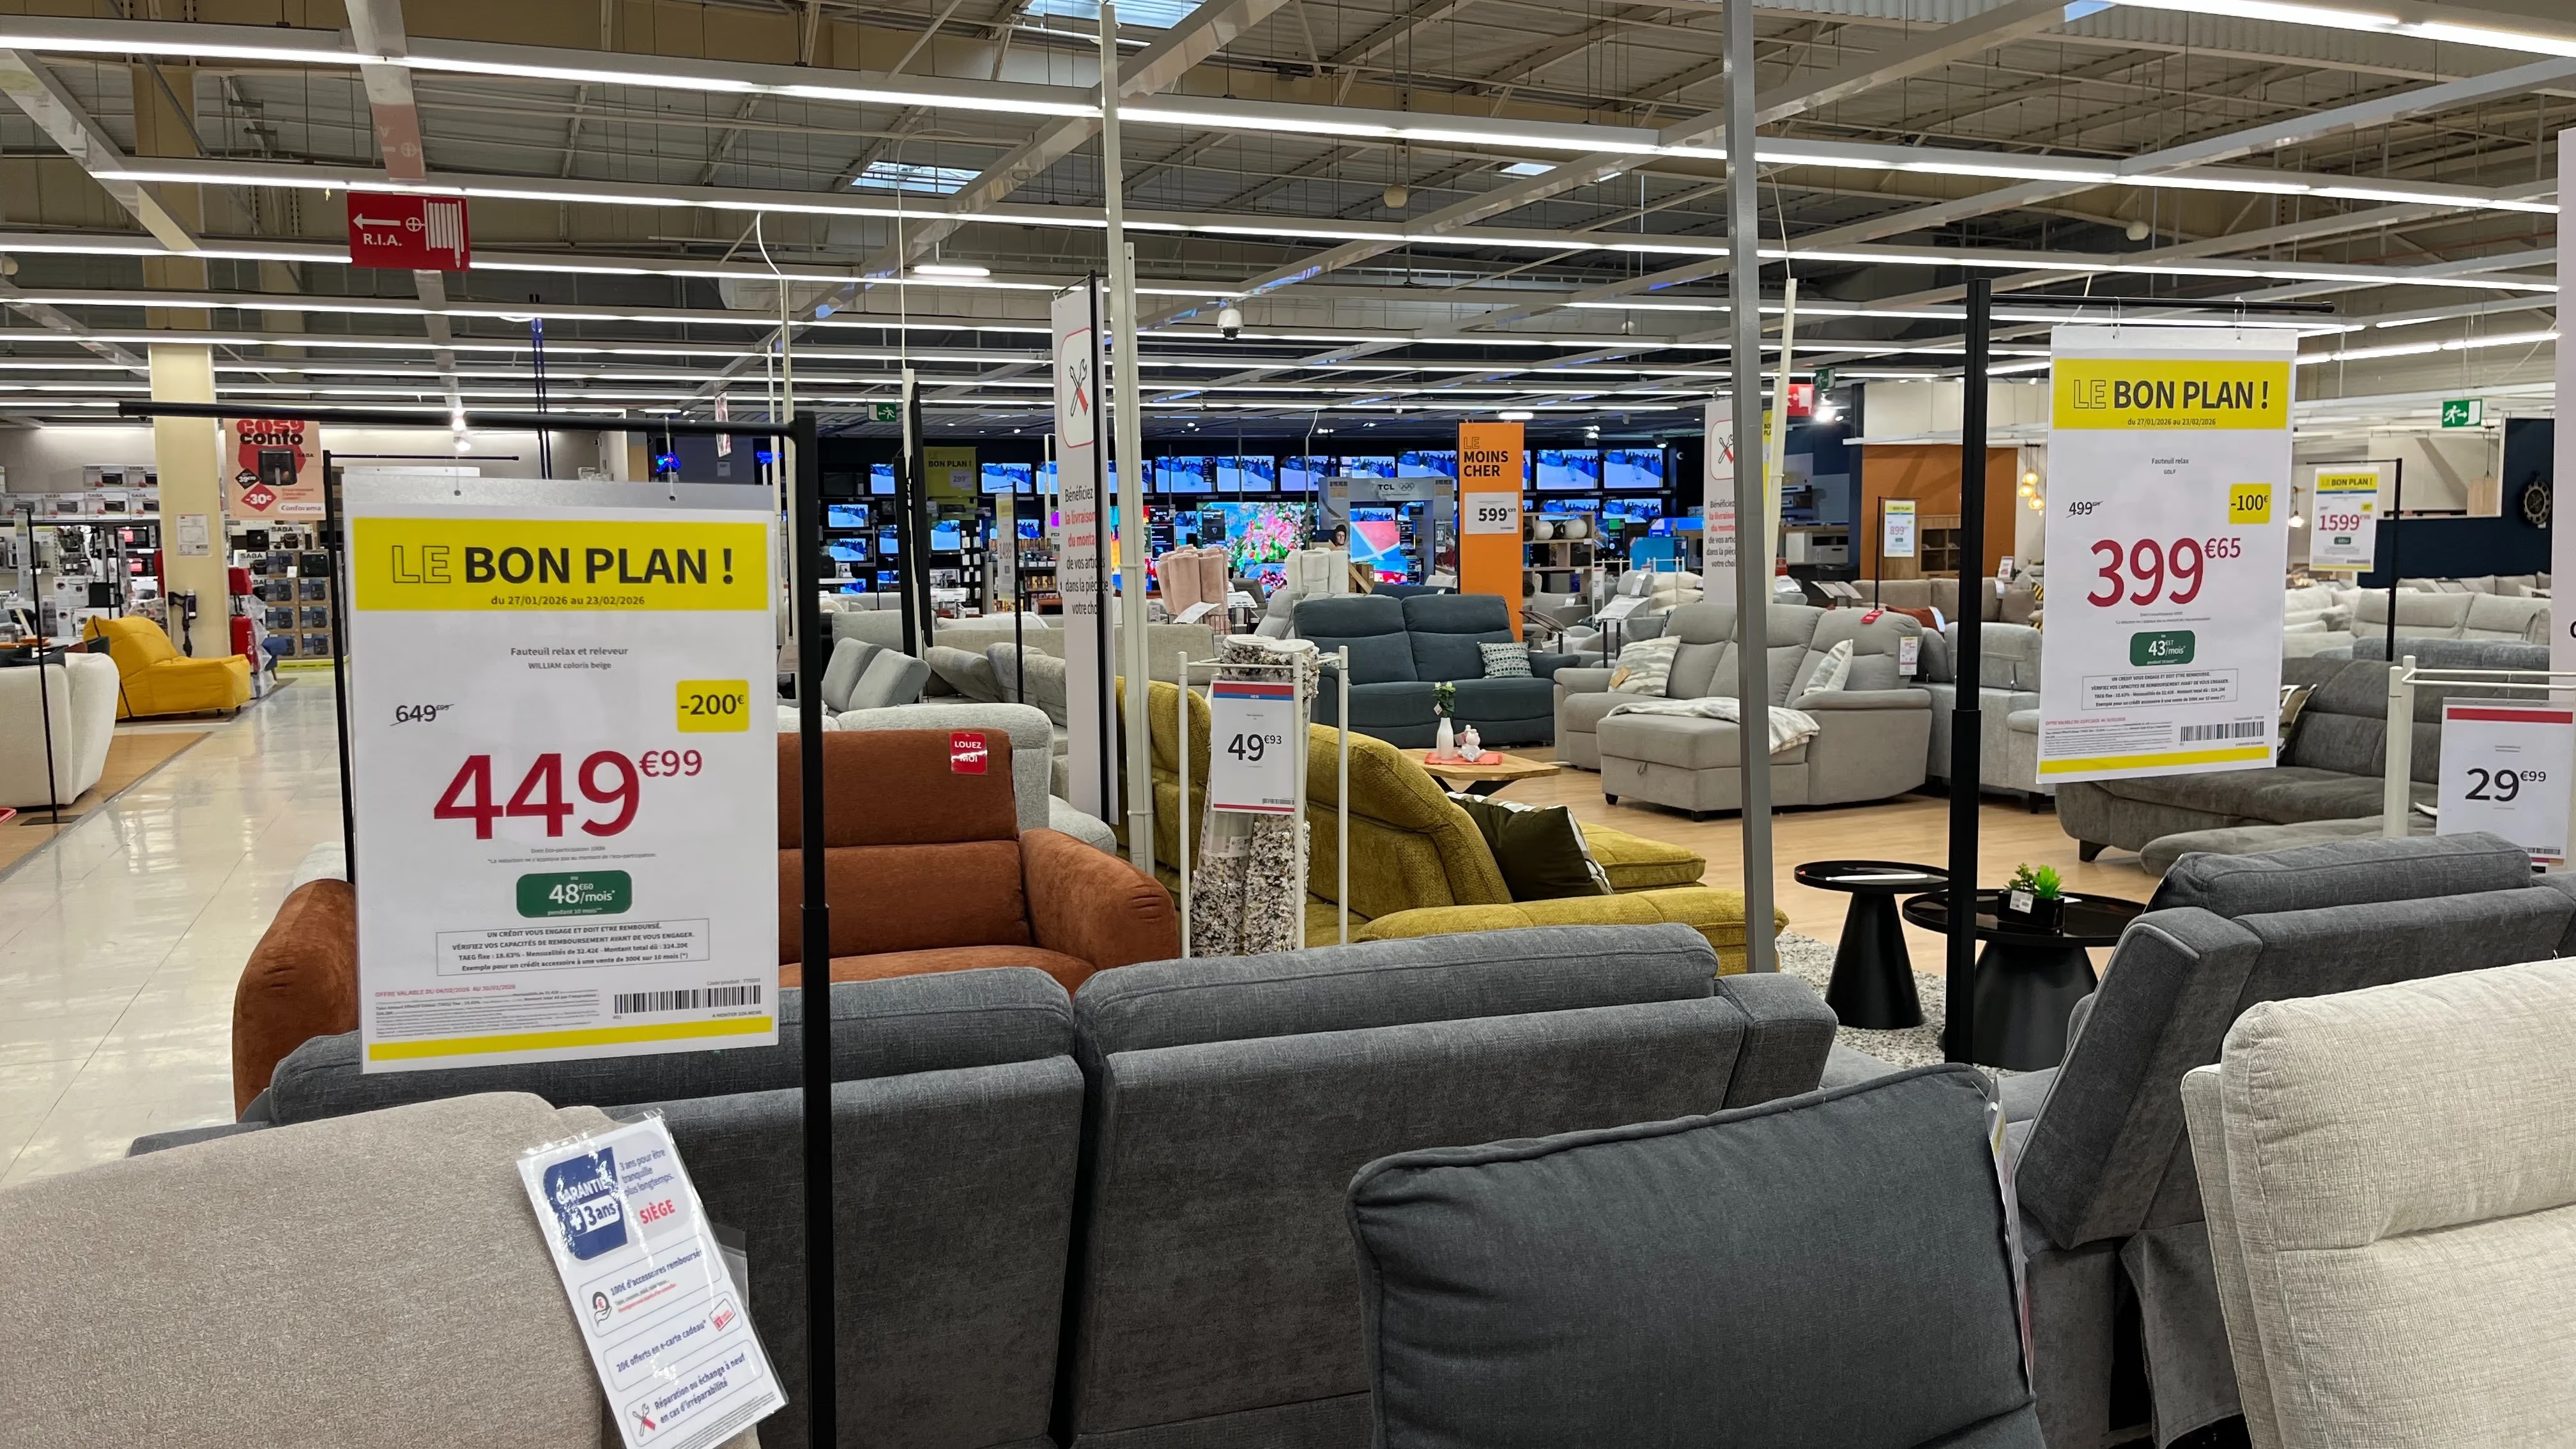
In a store, signage is the bridge between the offer decided at headquarters and the customer standing in front of the shelf. It informs, guides, and highlights. And when done poorly, it does the exact opposite: it misleads, undermines credibility, and becomes costly. For a single store, the task is manageable. For a network of dozens or hundreds of locations, it becomes an industrial challenge. Here is what effective signage looks like, the most frequent mistakes in the field, and why automation is a game-changer at the network level.
What in-store signage covers
Signage refers to all communication materials placed in-store to inform customers about products, prices, and promotions. It is not limited to price tags: it covers everything that speaks to the customer on the shelf. It is often confused with directional signage, which helps customers navigate the store, or with POS advertising, which promotes a specific brand. Signage, however, carries product information and pricing—the elements that legally bind the retailer.
Signage materials: what a network must manage
A retail chain constantly juggles several categories of materials, each with different constraints and production lead times. Paper materials, which remain the most common:
Posters, from small formats to large promotional displays.
Shelf price tags.
Shelf talkers, which highlight a product from the aisle.
End-cap display materials, for the most visible locations.
Large-format banners, particularly for store exteriors.
Electronic shelf labels, which are updated remotely and are gaining ground in high-turnover departments. Screen displays, televisions, kiosks, and tablets capable of displaying visuals or documents. Their use remains more marginal in standard signage today.
Large format signage, for retailer-wide messages.
The promotional poster, produced in bulk for every campaign.
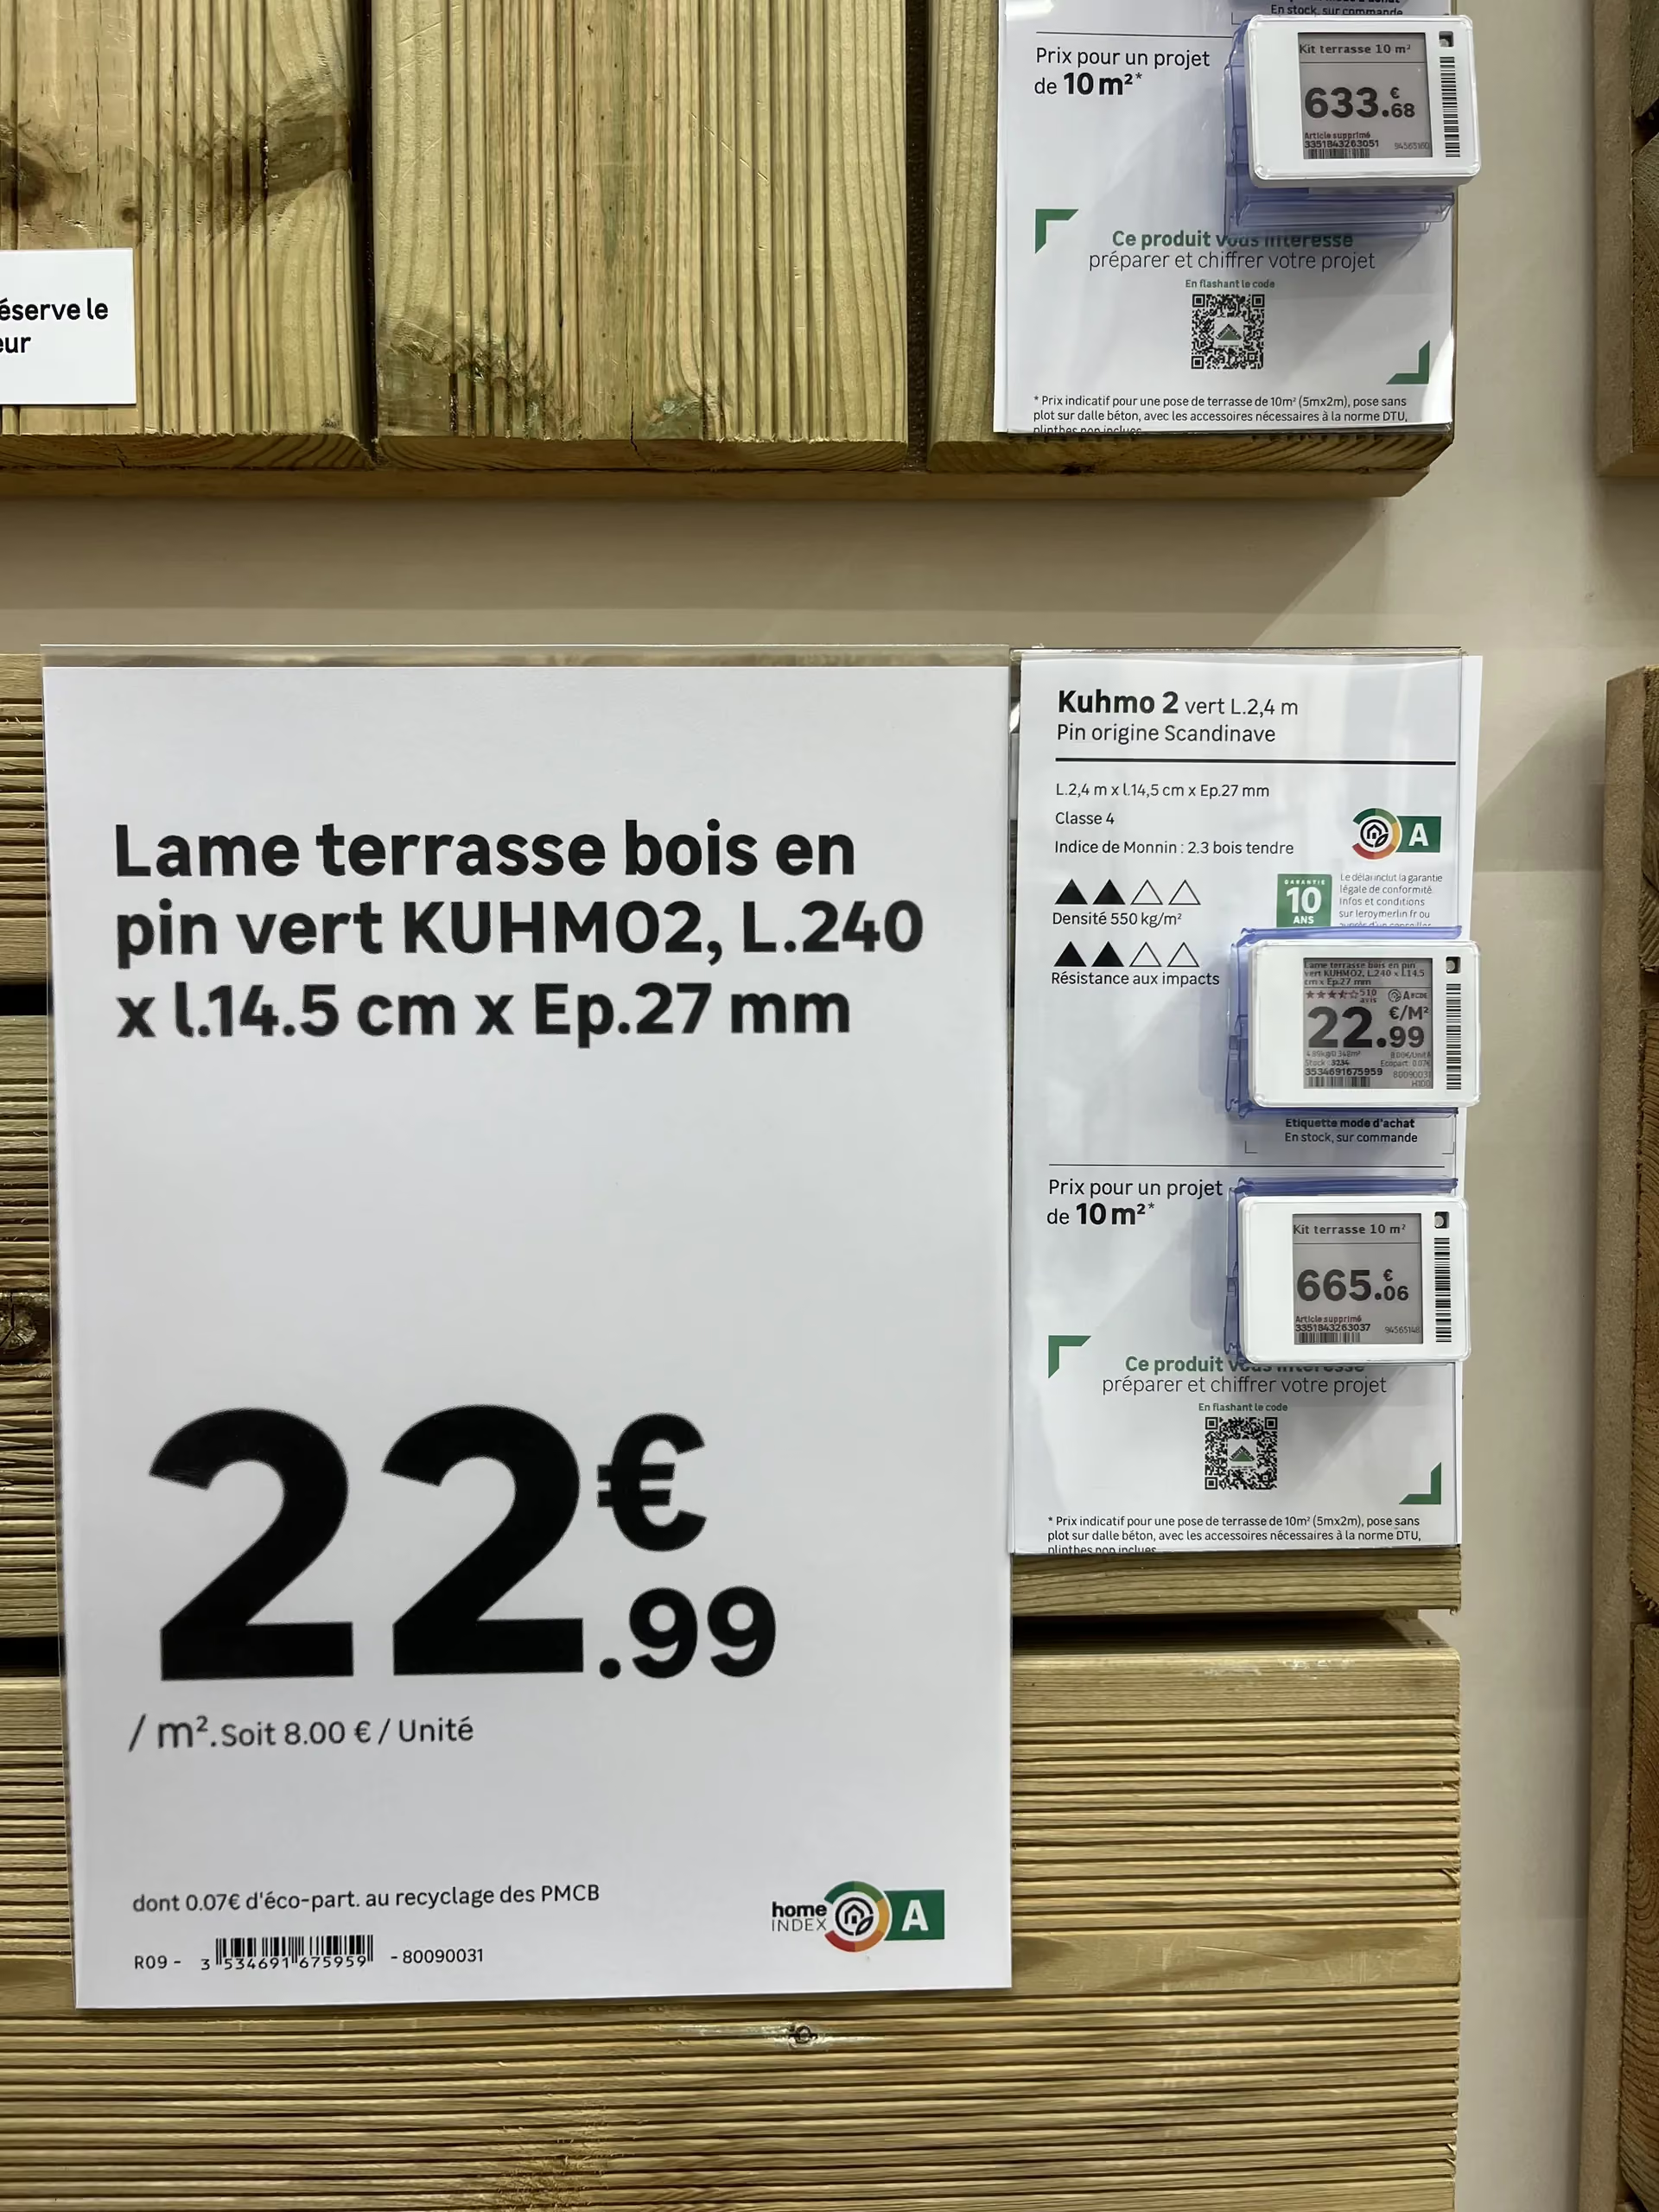
Paper and electronic labels often sit side by side on the same shelf.
Point-of-sale information, shaping the customer journey.
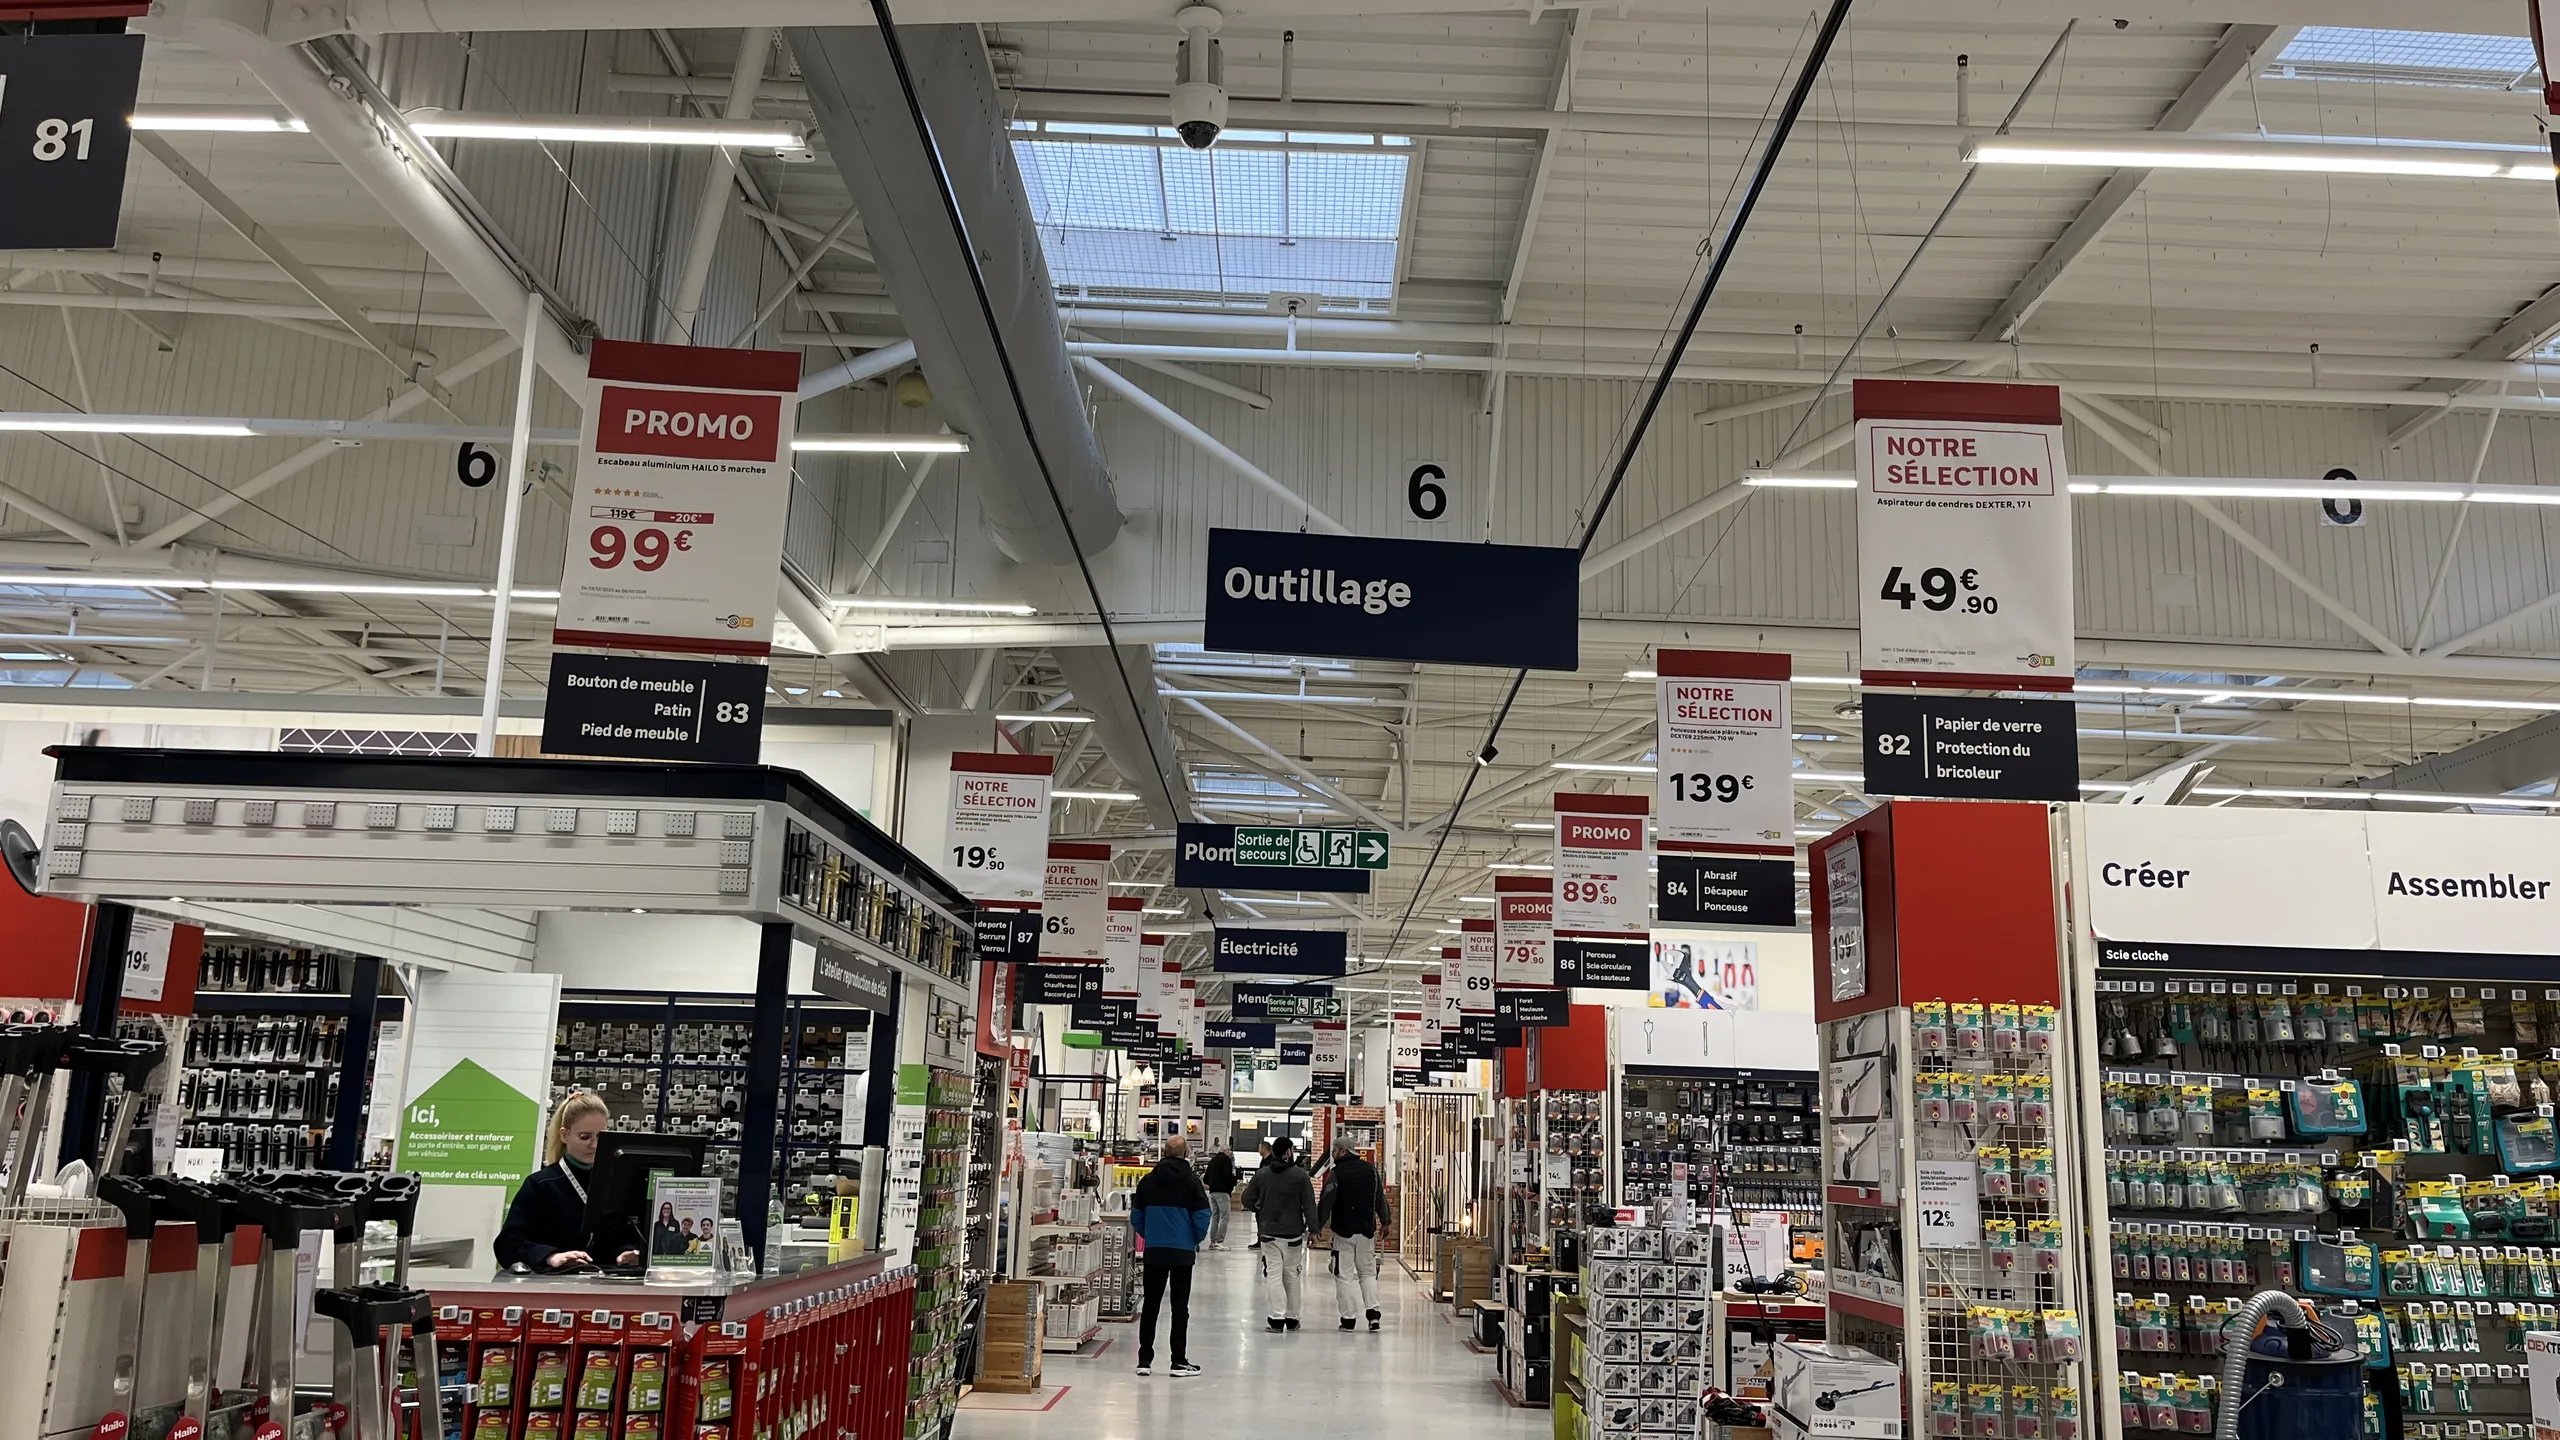
Overhead signage, visible from across the aisle.
The challenge is not producing one of these formats. It is producing the right ones, with the right data, at the right time, and consistently across the entire network.
The five criteria for successful signage
In the field, quality signage is recognized by five cumulative criteria. If even one is missing, the display loses its value or even becomes a liability.
Compliance with the brand's visual identity. The display must respect brand guidelines, regardless of which store produces it.
Regulatory compliance. Mandatory information must be present and accurate, including prices, units, and legal disclosures based on the product category.
Up-to-date data. The displayed price must match the price at the register, and product information must accurately reflect the current offer.
Flawless copy. A spelling mistake on an in-aisle sign directly damages the brand's credibility.
Impeccable graphic quality. No pixelation, clean framing, and accurate colorimetry.
The most common signage errors
These errors almost never stem from a lack of diligence by the teams. They occur because, without the right tools, each store recreates its signage manually, in a rush, using data entered by hand. Outdated pricing. This is the costliest error, as it creates a discrepancy between the shelf and the register, posing an immediate commercial and regulatory risk. Failure to follow brand guidelines. Adding a visual that violates brand guidelines, using an approximate color, or improvising a layout: the network loses its consistency, and each store ends up with its own identity. Inconsistent product data. The classic scenario: headquarters decides to communicate a feature in a specific unit, and the store uses another. The customer then compares information that cannot be compared from one aisle to another, or from one store to another. Spelling mistakes, which go unnoticed during creation but jump out at the customer. A promotional price higher than the original price. The most embarrassing error, which turns a sales campaign into an argument against the brand. This type of blunder spreads quickly on social media, where retail observers regularly post photos of these inconsistencies. The common thread in all these errors: they arise the moment information is re-entered manually instead of being pulled from the source.
The real challenge: scale
What makes signage difficult in a network is not the complexity of a poster. It is the volume, concentrated over short periods. The orders of magnitude observed at retail chains show the scale:
More than 220,000 posters generated in a single day across a chain of stores during Black Friday.
160,000 posters produced by a major home improvement retailer for a single Black Friday event.
3,000 posters per day on average for a distributor, which is nearly 100,000 per month.
10,000 signs per day during a standard period at another retailer, or 300,000 per quarter.
At these volumes, manual production is no longer an option. The bottleneck isn't the store; it's the ability to quickly generate accurate, compliant, and consistent signage.
Manual vs. automated signage: what changes
Criterion
Manual signage
Automated signage
Volume handled
Manual signageLimited by the time available in store
Automated signageThousands of displays generated in a single run
Price accuracy
Manual signageRisk of a gap between the shelf and the till
Automated signagePrices taken straight from the retailer's systems
Manual signageRe-entered by hand, exposed to errors and typos
Automated signageTaken at source, consistent across the network
Print quality
Manual signageDepends on each team's time and resources
Automated signageConsistent output, true to approved templates
Network rollout
Manual signageStore by store
Automated signageIn one go across every point of sale
Volumes and observations drawn from PiiVO retail customers, for guidance only. Results vary with network size and the type of campaign.
How automation solves the problem
Automating signage isn't about producing the same materials faster. It's about eliminating the step that causes errors: manual data entry. Data is pulled directly from the source. Pricing, product names, specifications, and mandatory disclosures come straight from the retailer's systems. What is displayed on the shelf therefore matches what is actually in the system. Templates are centralized. Headquarters defines the templates, ensuring they comply with brand guidelines and regulations. Stores don't recreate anything; they generate. Network consistency is guaranteed by design. Deployment is global. A campaign is launched simultaneously across all relevant stores, rather than depending on the availability and diligence of individual teams. Teams are freed up. Time previously spent creating signage is returned to sales and customer service, especially during peak periods.
In summary
Signage is not just a minor execution detail; it is the final link between a retailer's commercial strategy and its customers. Accurate signage inspires confidence, while sloppy signage casts doubt on everything else. For a retail network, the goal is not just to make prettier posters, but to ensure that every piece of signage in every store is compliant, up-to-date, and consistent, regardless of the production volume. This is precisely what data-connected signage automation enables.
Omnichannel consistency
Large corporations
Why is automation the pillar of brand consistency?
Network consistency relies on centralizing assets at headquarters and automating their production using brand data. This approach eliminates discrepancies between headquarters and points of sale, freeing store teams from repetitive tasks. In a competitive market, this visual uniformity becomes a genuine brand asset.
Read the article
00
min read
Every brand manager knows the feeling.
Walking into one of your stores and sensing, from a single display detail, that something doesn't quite align with the national image. A hand-drawn sign, a poorly framed promotion, a stray price tag. It may seem minor, but that is often where the loss of consistency begins.
The stakes of brand image across a network
An integrated network is built on a simple promise: the customer should have the same experience whether they walk into a store in Lille or Marseille. The operational reality is often different. Without a standardized tool, each point of sale ends up creating its own materials and signage to handle urgent shelf needs.
Take a department manager on a busy Friday evening without the right printed materials on hand. They open a word processor, cobble together a sign, print it, and put it up. They did their job; they handled the emergency. But multiply that action by hundreds of stores and dozens of occasions per year, and you end up with a visual patchwork that bears no resemblance to the polished identity intended by headquarters.
This is what we call local DIY: approximate fonts, distorted logos, and amateur layouts. In isolation, these deviations seem harmless. Accumulated across a large network, they dilute the national identity and weaken the perception of the brand's quality.
Manual vs. automated display management: what changes
The contrast between manual and automated management is evident in five concrete aspects of daily network operations.
Visual consistency. With manual management, it varies from one store to another based on local habits. With automated management, it is identical across the entire network.
Brand guidelines. Left in the hands of each point of sale, they eventually get altered. Locked into centralized templates, they remain intact everywhere.
Price updates. When manual, they rely on re-entry, which is a source of errors and shelf discrepancies. When automated, they are synchronized directly from the brand's data.
Campaign deployment. It takes several days when each store produces its own materials. It drops to just a few hours when everything comes from a centralized production source.
Store team time. Absorbed by creating materials in the first scenario, it is refocused on sales and customer advice in the second.
This contrast sums up the challenge: automating signage is not just a cosmetic convenience, it is an industrial safeguard for your brand image.
Ending local DIY with automated templates
To eliminate this inconsistency, the solution is not constant manual control, which is impossible to maintain across a large network, but rather providing intelligent templates. By centralizing templates at headquarters, the brand guarantees three things.
The brand identity is locked : fonts, colors, and logos are fixed within the templates and can no longer be altered locally.
Content remains dynamic : each material is automatically populated with the correct prices, descriptions, and visuals, with no re-entry required.
Autonomy is managed : the store retains the ability to produce its materials on demand, but always within the framework validated by headquarters.
This is the balance every network seeks: a nationally controlled image with flexible local execution.
Data synchronization: the right price everywhere, all the time
Connecting the brand's data streams—whether from the PIM, DAM, or ERP—to shelf labeling is the engine of this transformation. The major risk in retail remains the discrepancy between the displayed price and the price paid at checkout, a source of customer dissatisfaction and regulatory exposure. With automated production, data becomes live and reliable.
Zero manual entry : pricing data from the ERP flows directly to labels and signage, with no manual intervention required.
Reliable display : price updates are automatically reflected across all relevant media, minimizing the risk of discrepancies on the shelf.
Immediate responsiveness : price changes or promotional campaigns can be rolled out across the entire network in just a few hours.
Automation: a driver of overall performance
Beyond the visual aspect, automating signage is a key driver of profitability. By freeing department managers from time-consuming administrative tasks, the brand restores their primary mission: sales and customer service.
Automating signage isn't about taking away a team's role; it's about giving it back to them. A department manager didn't choose this career to recreate labels at a desk, but to bring their store to life and advise their customers. Giving this time back to the teams is arguably the most concrete—and human—benefit of this transformation.
In a sector where operational excellence makes all the difference, shifting from a culture of data entry to a culture of management is one of the best investments a network can make to sustain its growth and value its human capital.
Omnichannel consistency
Large corporations
From product data to print: how to automate label creation
Behind every price tag lies a chain of information that travels from head office systems to the store shelf. Discover how to connect your ERP, PIM, and DAM to your signage creation process to produce accurate labels in bulk and automatically push them to printers and electronic shelf labels.
Read the article
00
min read
How can you automate the creation of in-store price labels and signs? By connecting your signage creation tool to your retail systems (ERP, PIM, DAM, POS, e-commerce site). Price, product name, specifications, and mandatory information are pulled directly from the source, the correct template is selected automatically, and the sign is sent to the printer or electronic shelf label—with no manual re-entry required.
A price tag seems simple. A price, a product name, a few details. Yet, behind every sign placed on a shelf, there is a chain of information that starts at head office and must reach the customer intact. As long as this chain relies on manual re-entry, it will break regularly. Automation is precisely about eliminating these gaps: product data feeds the sign directly, from start to finish. Here is how it works in practice, step by step.
The real problem: information re-entered at every stage
In a manual workflow, product information is copied multiple times before it reaches the shelf. The price is defined in one system, the name in another, and the specifications in a third. In-store, a team member then pulls it all together to create the sign. Every time information is copied, there is a risk of error: a transposed digit, a unit of measure that differs from head office guidelines, a missing mandatory notice, or a promotional price that is no longer valid. These discrepancies aren't due to a lack of diligence; they are inherent to the process itself. The solution, therefore, is not to copy more carefully. It is to stop copying altogether.
Where does sign data come from?
A complete price sign draws on information from several retail systems. Connecting your signage tool to these sources allows you to pull each piece of data from its authoritative source.
System
What it provides
What appears on the sign
ERP
What it providesPrices, promotions, validity dates
On the signDisplayed price, was-price, discount, offer period
PIM
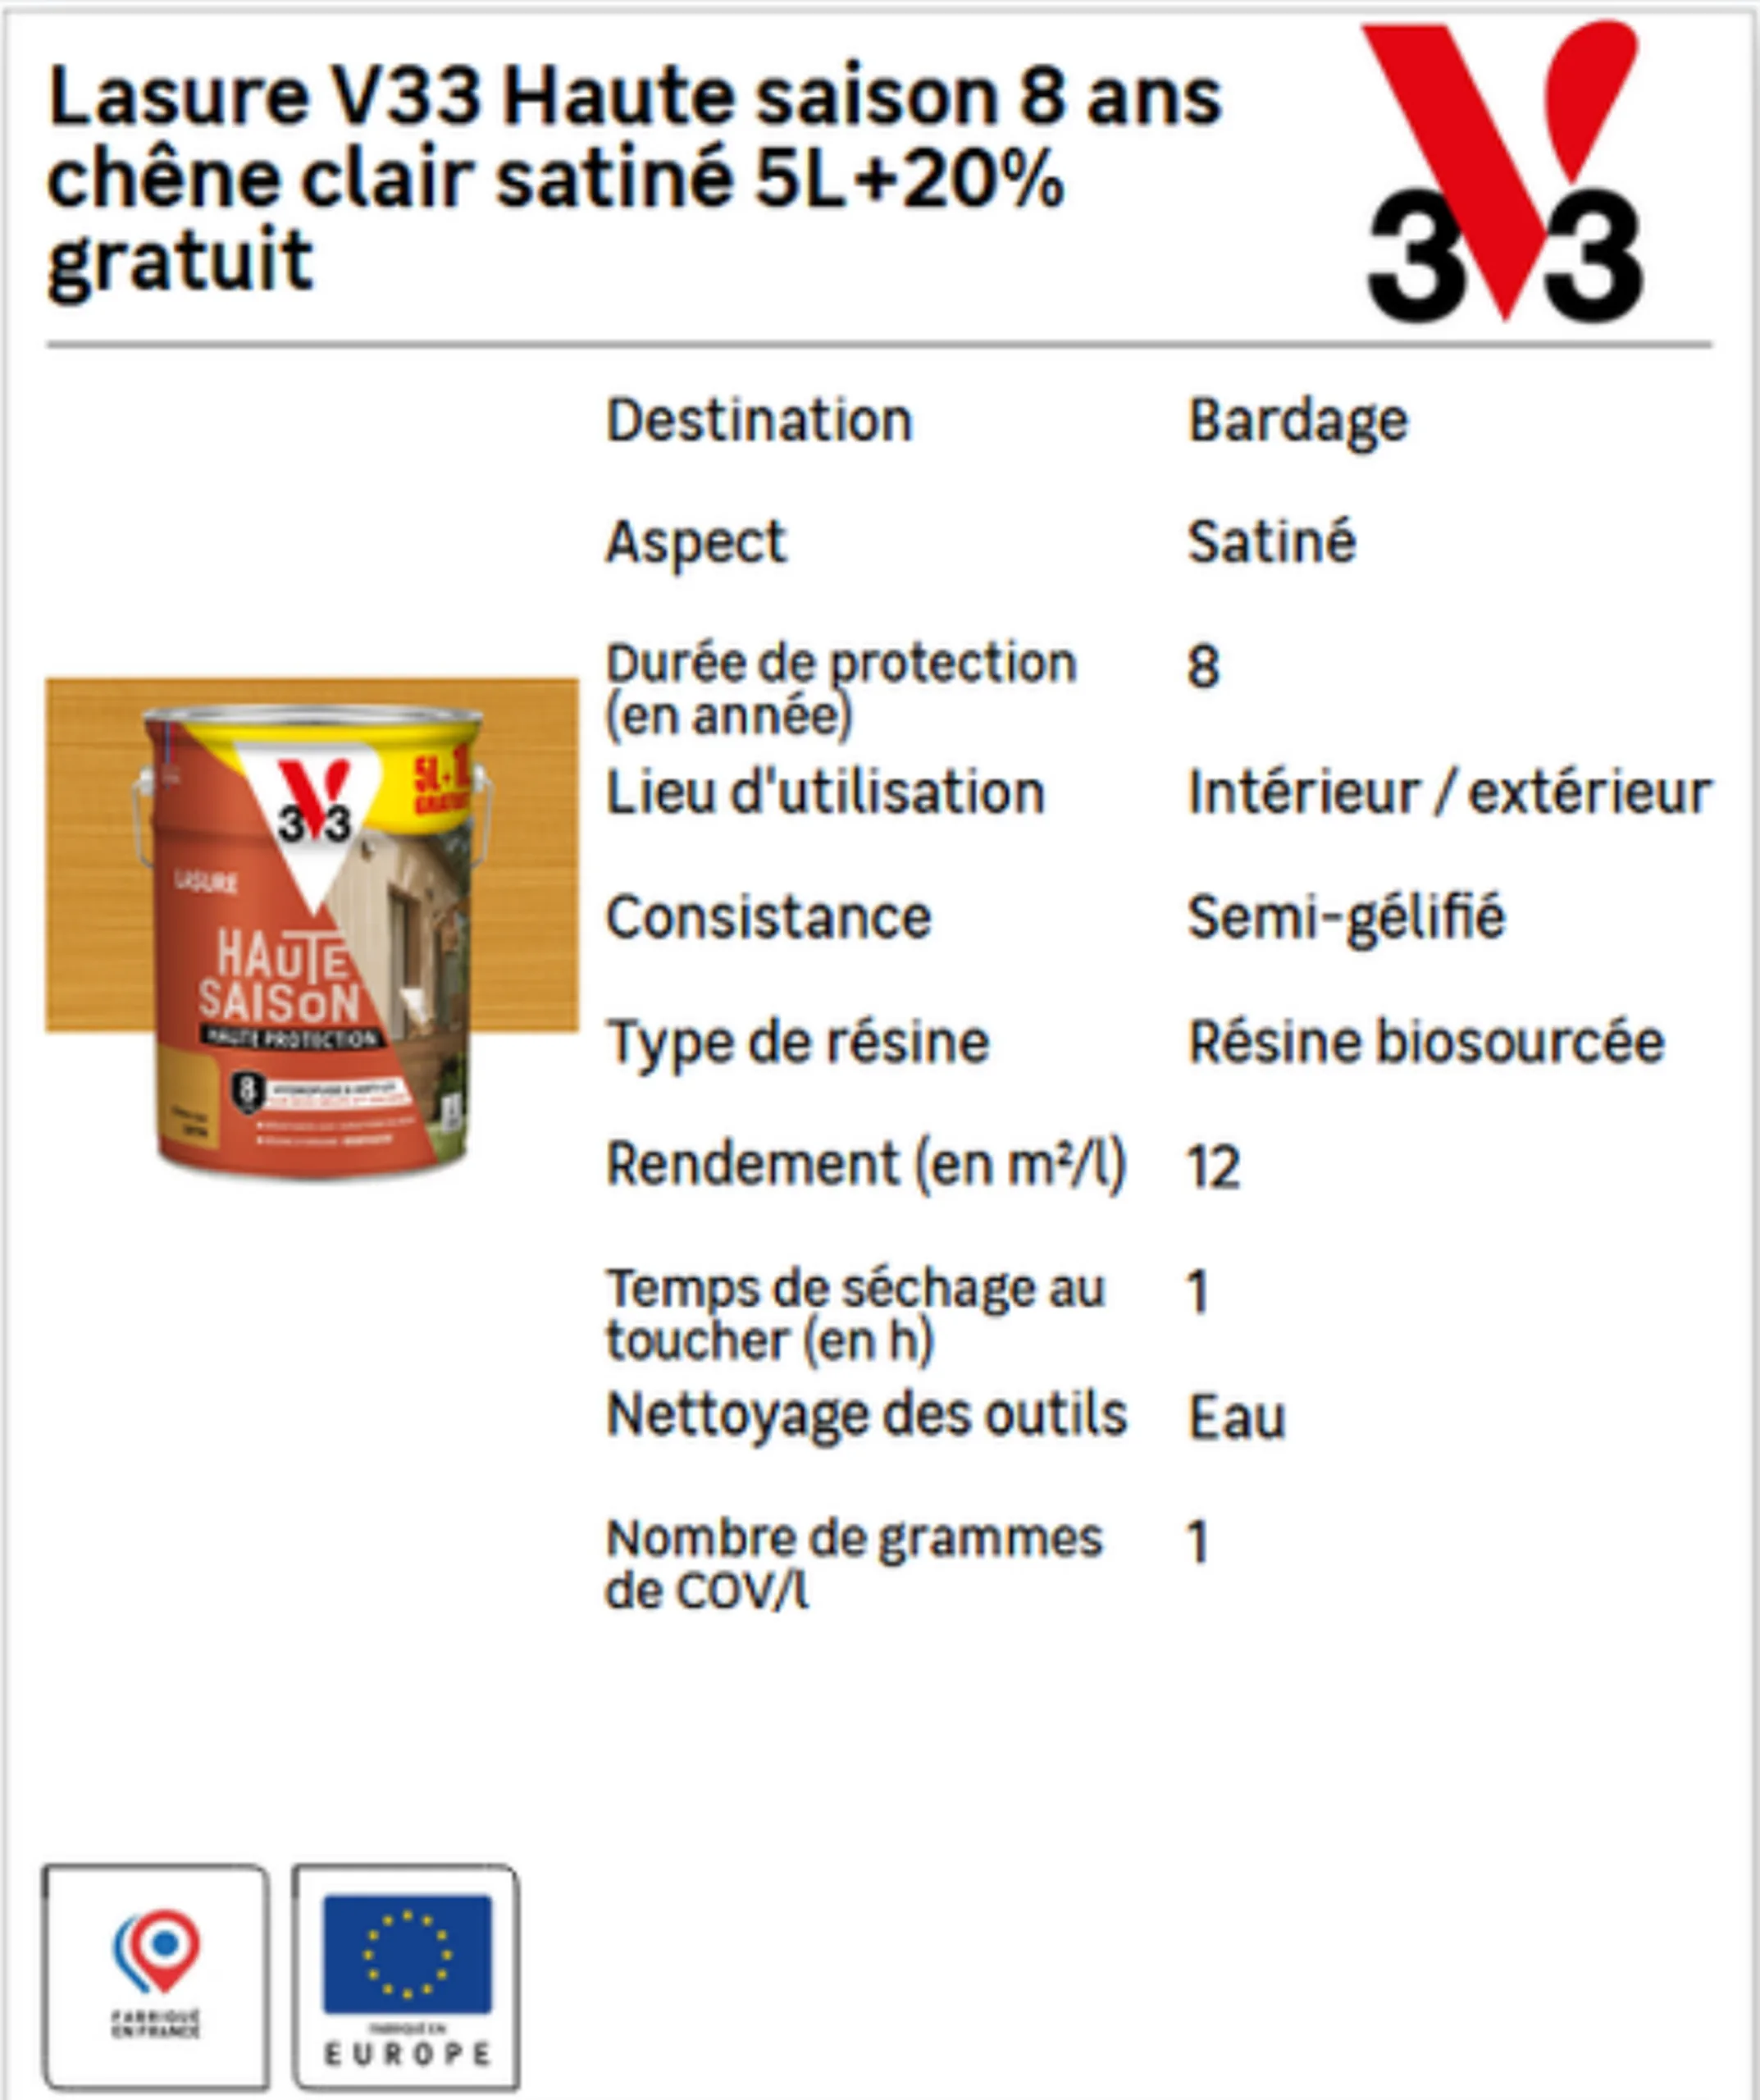
What it providesProduct name, specifications, product family
On the signProduct title, technical sheet, regulatory pictograms
DAM
What it providesProduct images, brand logos
On the signProduct photo, logo
Till system
What it providesPrice actually charged
On the signConsistency between shelf and till
E-commerce site
What it providesOffer published online
On the signConsistency between store and website
Typical role of each system, for guidance only. The exact split of data varies with each retailer's own set-up.
The principle is always the same: each piece of information is read from its reference system and then automatically assembled onto the sign. This ensures the price on the shelf matches the price in the system, and the store presents the same offer as the website.
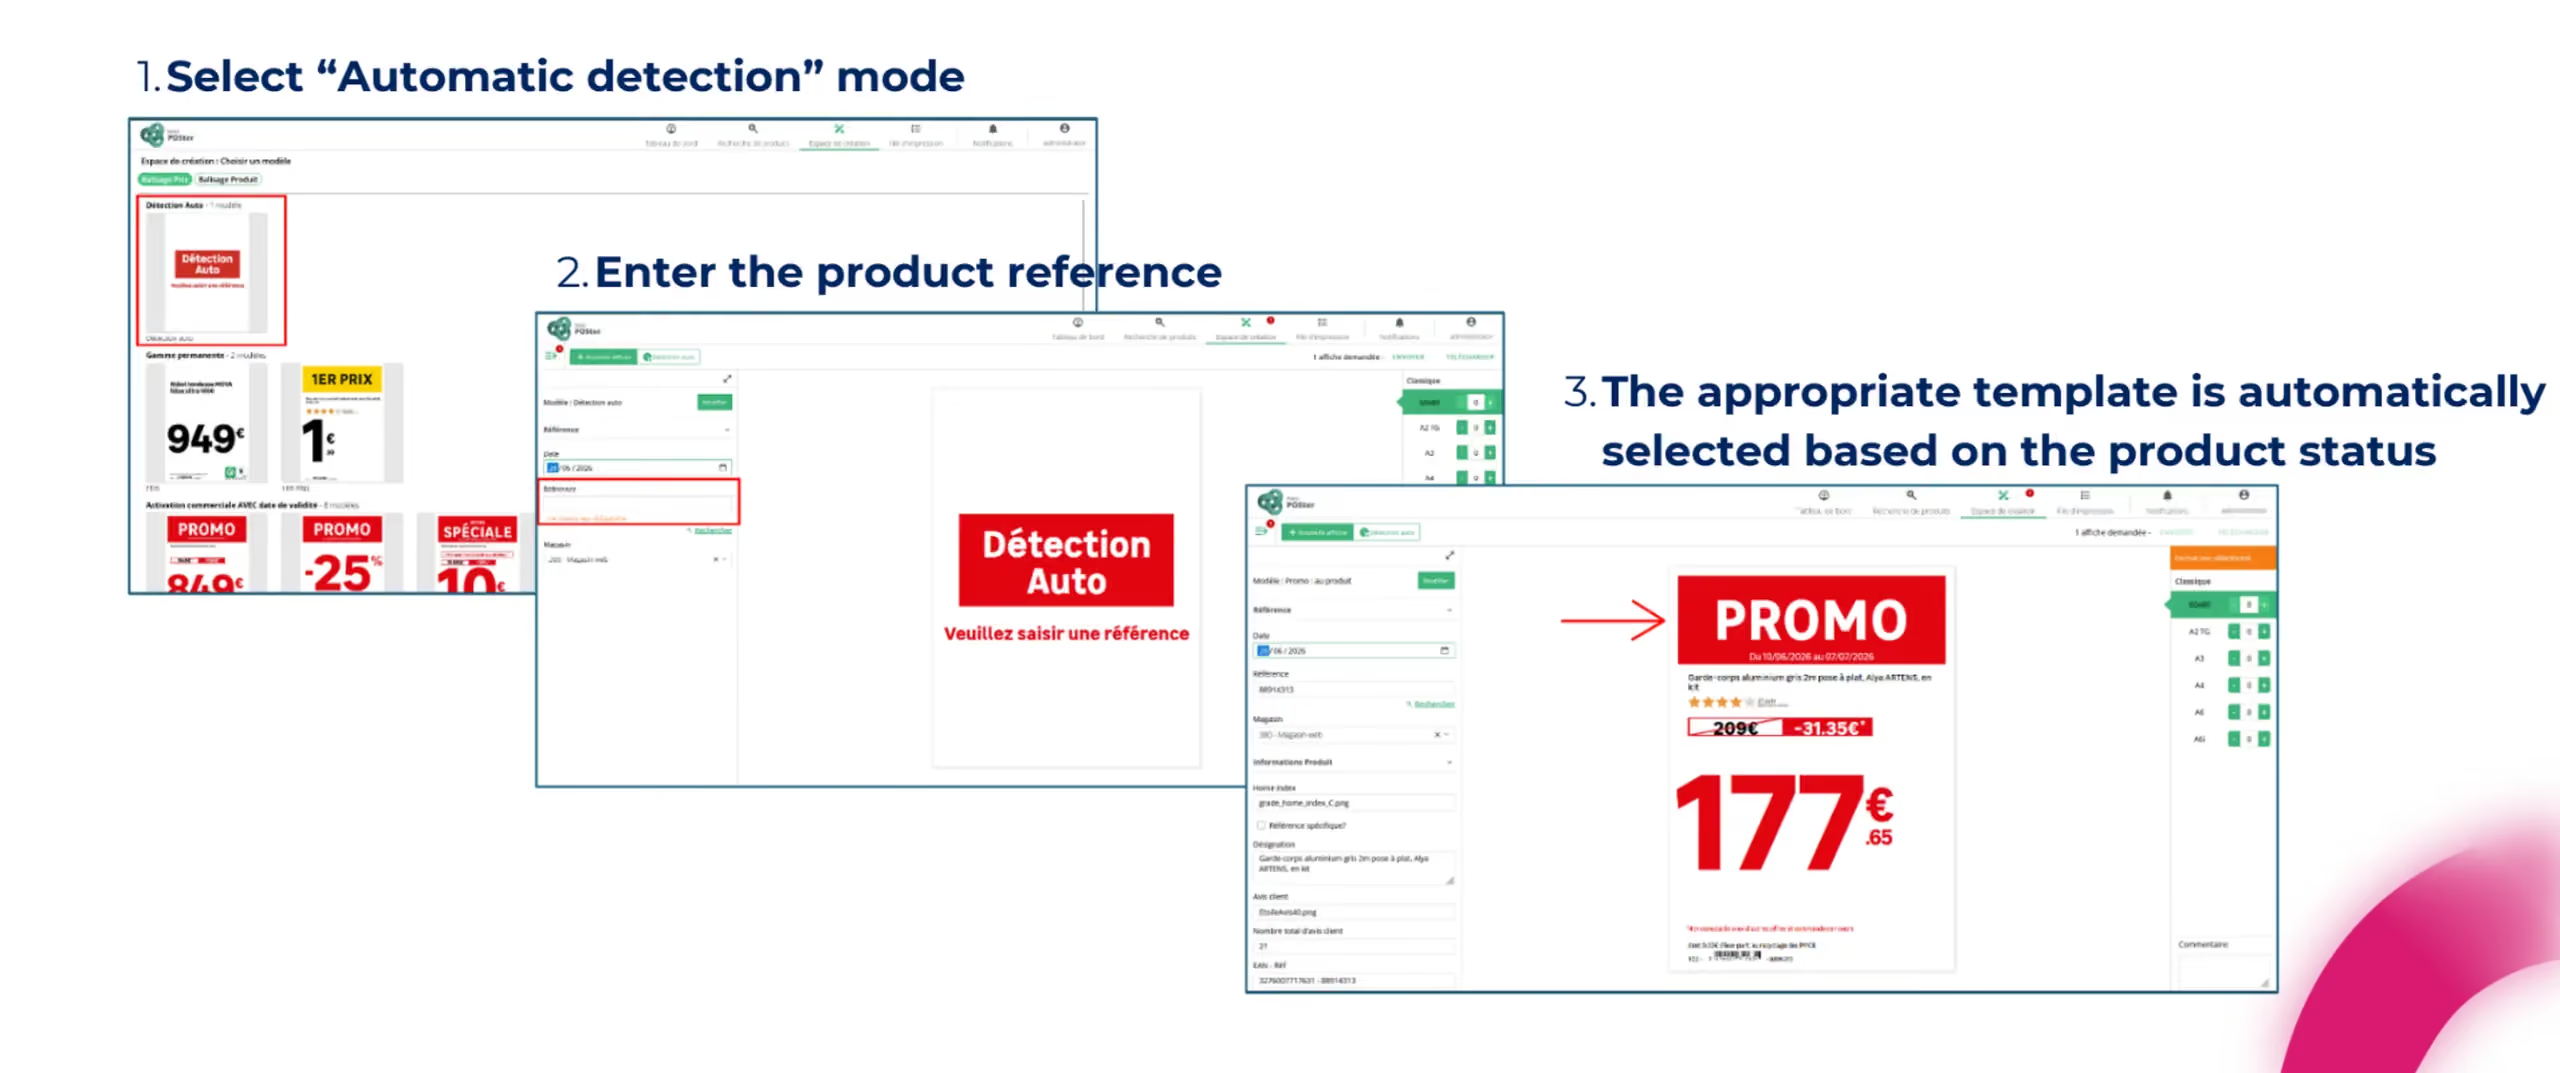
How data becomes a sign, in three steps
To create a data-connected sign, team members no longer need to design anything. The process takes just three steps.
They select the automatic detection mode. Instead of choosing a sign template themselves, they let the platform decide.
They enter the product reference. This is the only information they need to provide.
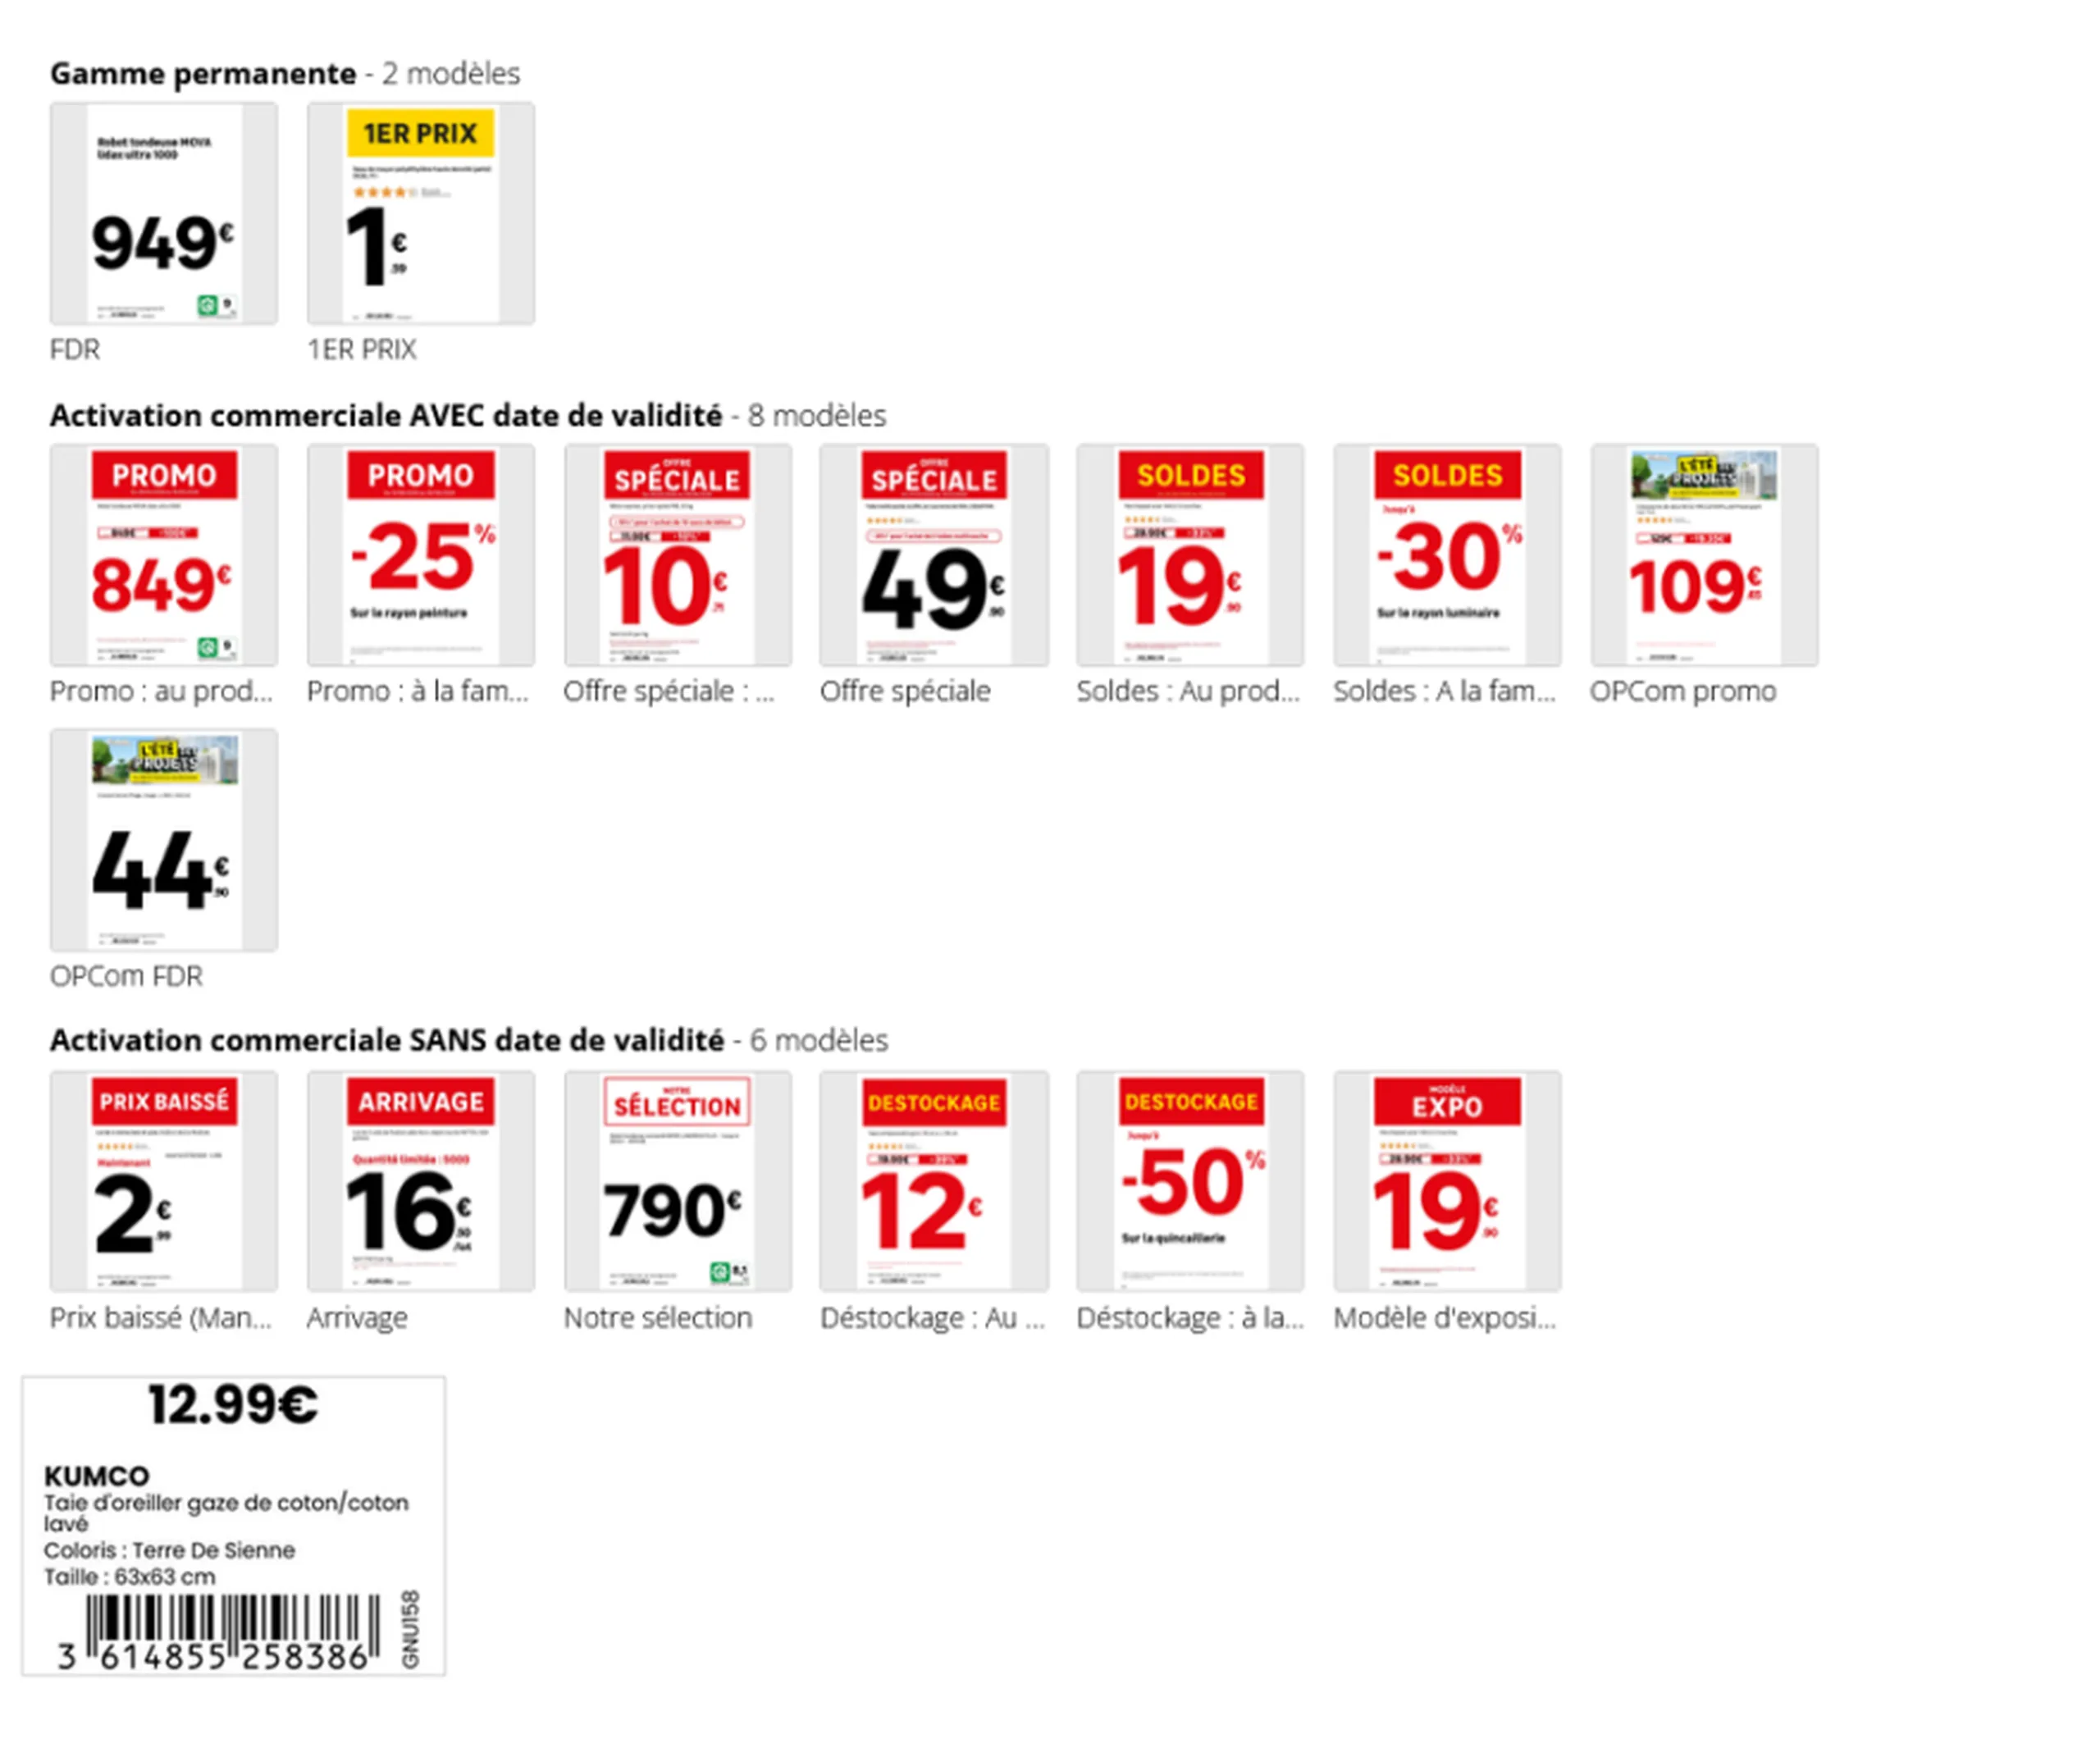
The appropriate template is selected automatically based on the product's status. Promotional products are assigned a promotional template, new arrivals get an arrival template, and permanent prices use a standard template. The sign is generated with all up-to-date data.
The team member selects automatic detection, enters a reference, and the template matching the product status is applied.
Head office maintains a centralized view of all print jobs, can send print requests to stores, and provide them with files created by agencies.
What automation calculates for you
Beyond simply pulling data, the platform handles calculations and decisions that are common sources of manual error:
Price type, whether permanent, promotional, discounted, or entry-level.
Discount calculations, in both absolute amounts and percentages.
Sales unit and unit price, such as price per liter or per kilo, selected based on the product or its category.
Promotional campaign affiliation, including validity dates.
Technical specifications and regulatory icons, populated automatically based on the product category.
Language, automatically adapted to the user's store within an international network.
These are precisely the types of calculations where an error easily goes unnoticed during creation, but stands out to the customer on the shelf.
From single items to mass creation
Creating one sign at a time is fine for occasional needs. For a sales event, you need to produce hundreds or even thousands of materials.
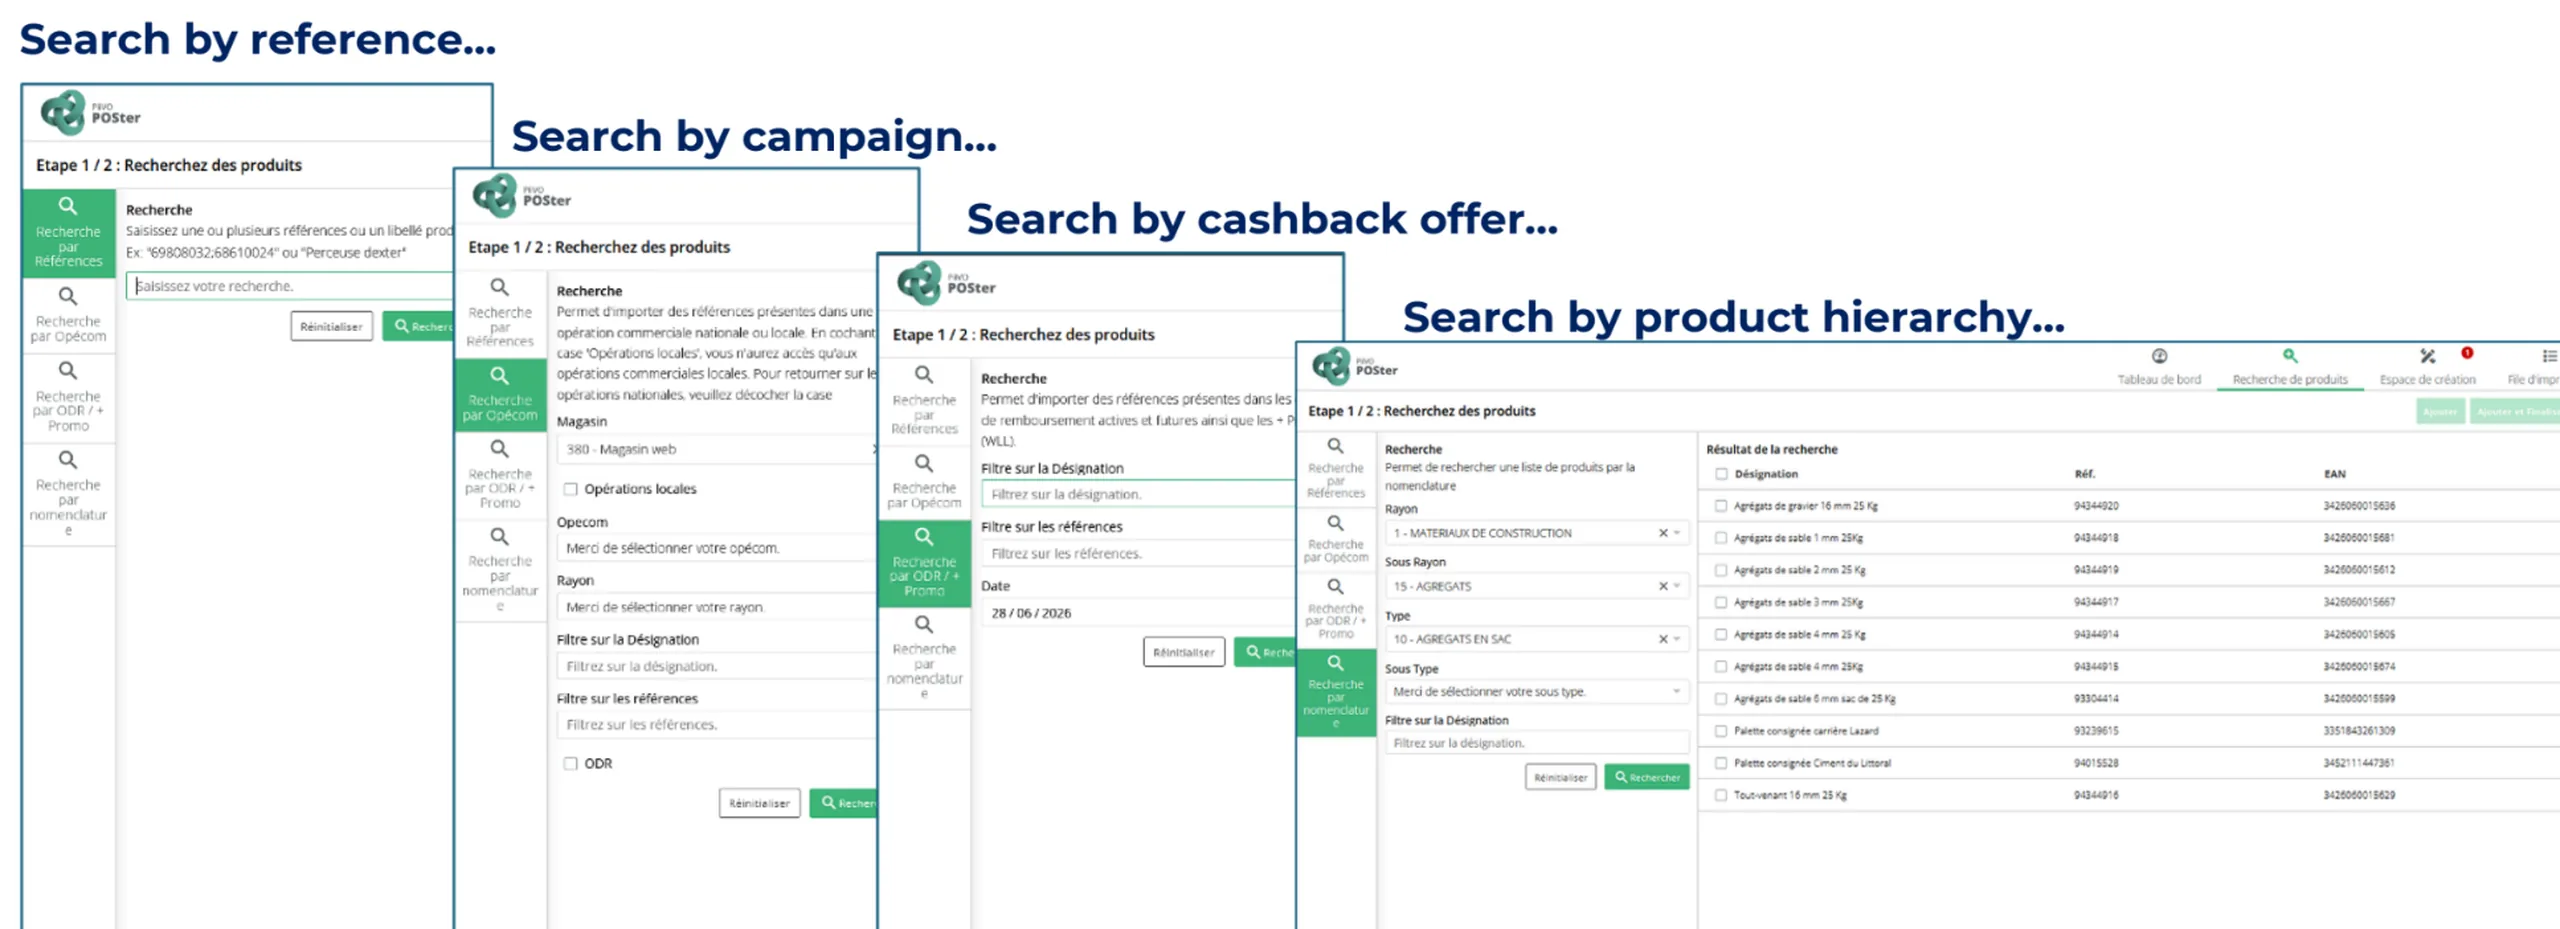
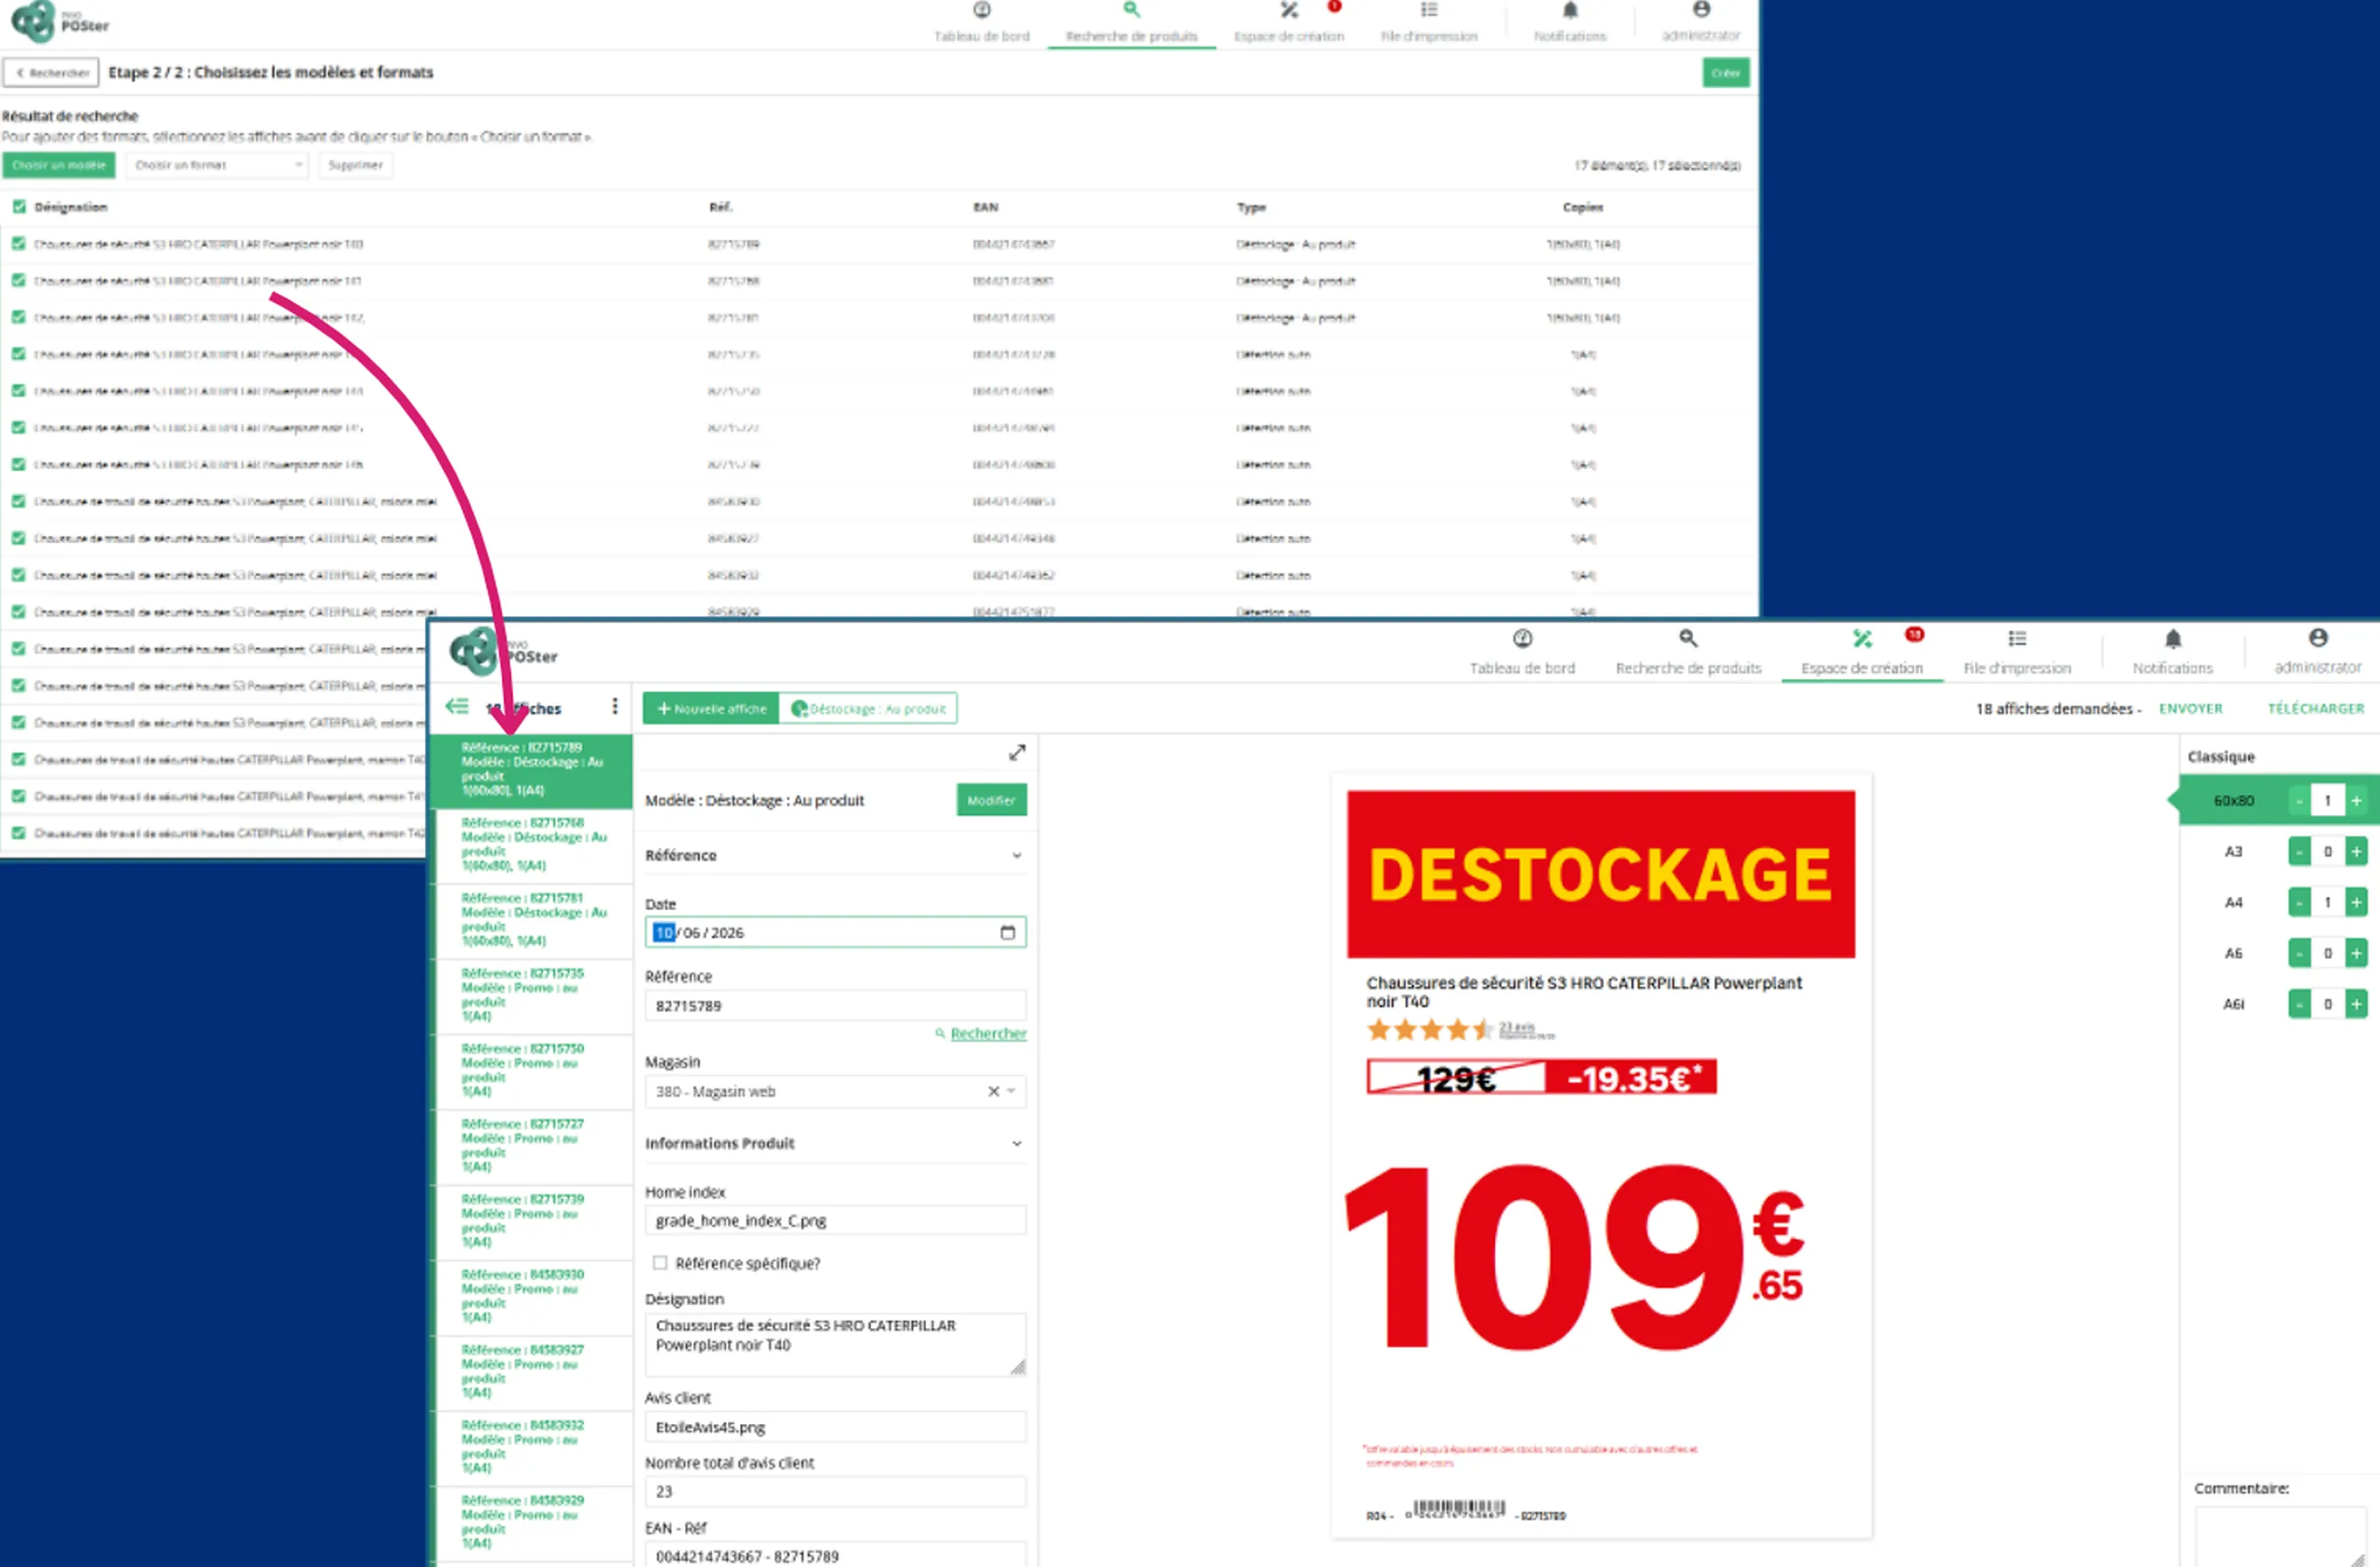
Bulk creation begins by searching for products based on several criteria: by reference, campaign, rebate offer, or nomenclature. Search filters can be customized to match the retailer's organization. Once products are selected, simply choose the templates and formats to generate up to 1,000 displays in a single operation.
Multi-criteria search, the starting point for bulk creation.
The selected products, and the signs generated in a single run.
The unit of measure is chosen automatically according to the product.
Specifications and pictograms are filled in according to the product family.
One template per commercial situation, applied automatically.
Across a network during peak periods, these operations multiply. During Black Friday, all participating retailers can generate over 220,000 posters in a single day, by aggregating operations from all stores.
From poster to shelf: automated distribution
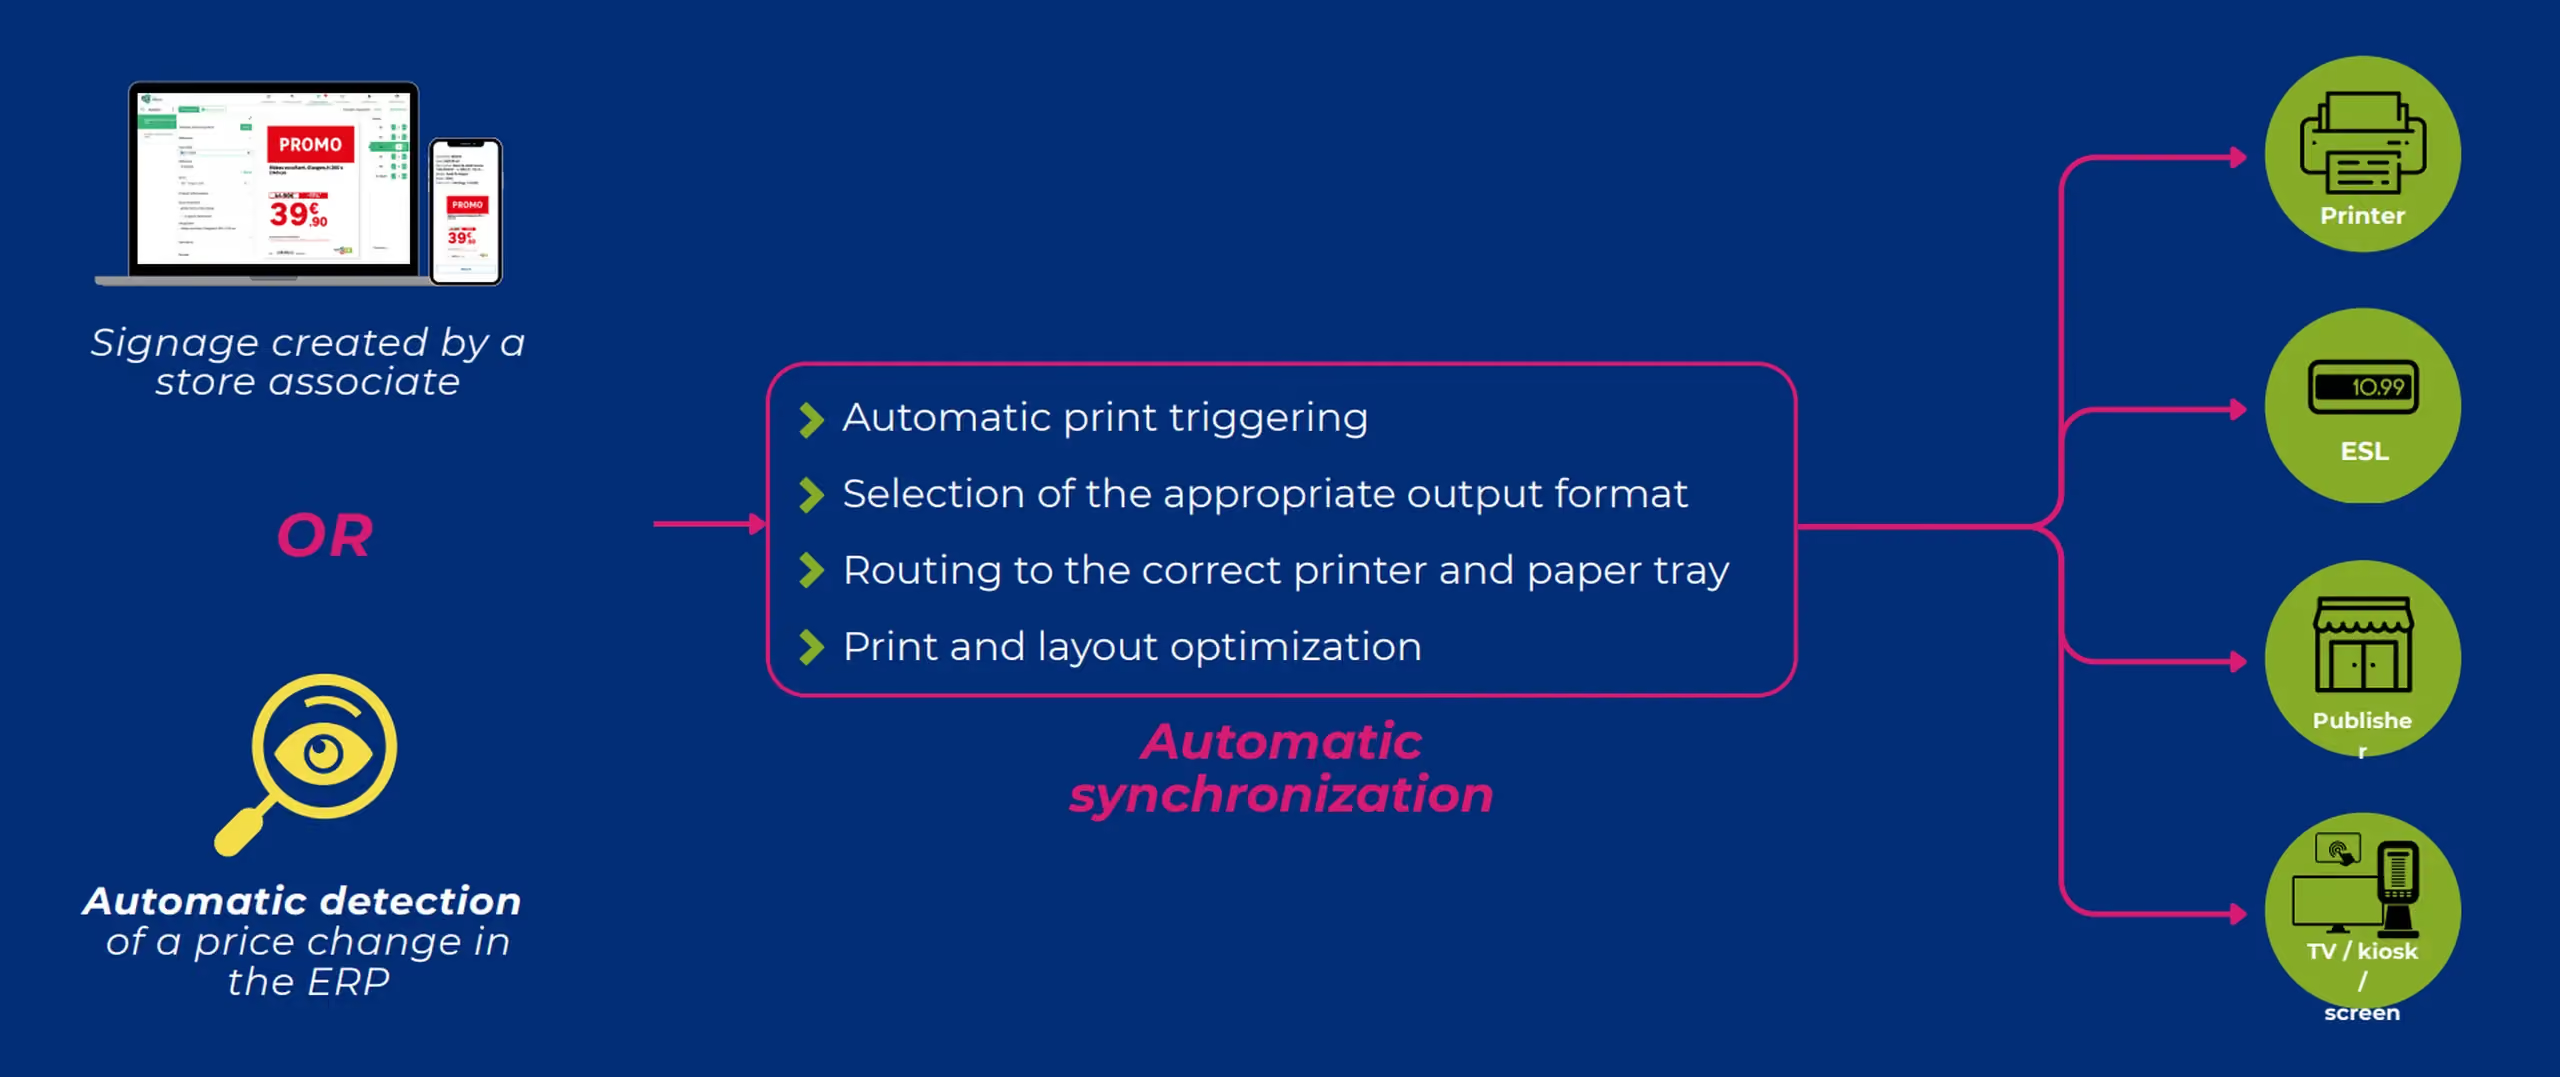
Producing the poster is not enough; it must also reach the right place in the right format. This is the final step to automate. The process can be triggered from two sources: a staff member creating the poster in-store, or the automatic detection of a price change in the ERP. In both cases, the following steps occur without intervention:
Printing is triggered automatically, or the appropriate output format is selected.
The document is routed to the correct printer and paper tray.
Printing and layout are optimized.
Electronic shelf labels are updated at the same time as paper materials.
A price change in the ERP is enough to trigger updates to every affected display.
Meanwhile, headquarters maintains a centralized view of all print jobs, can send print requests to stores, and provide them with files created by agencies.
In the field: print directly from the aisle
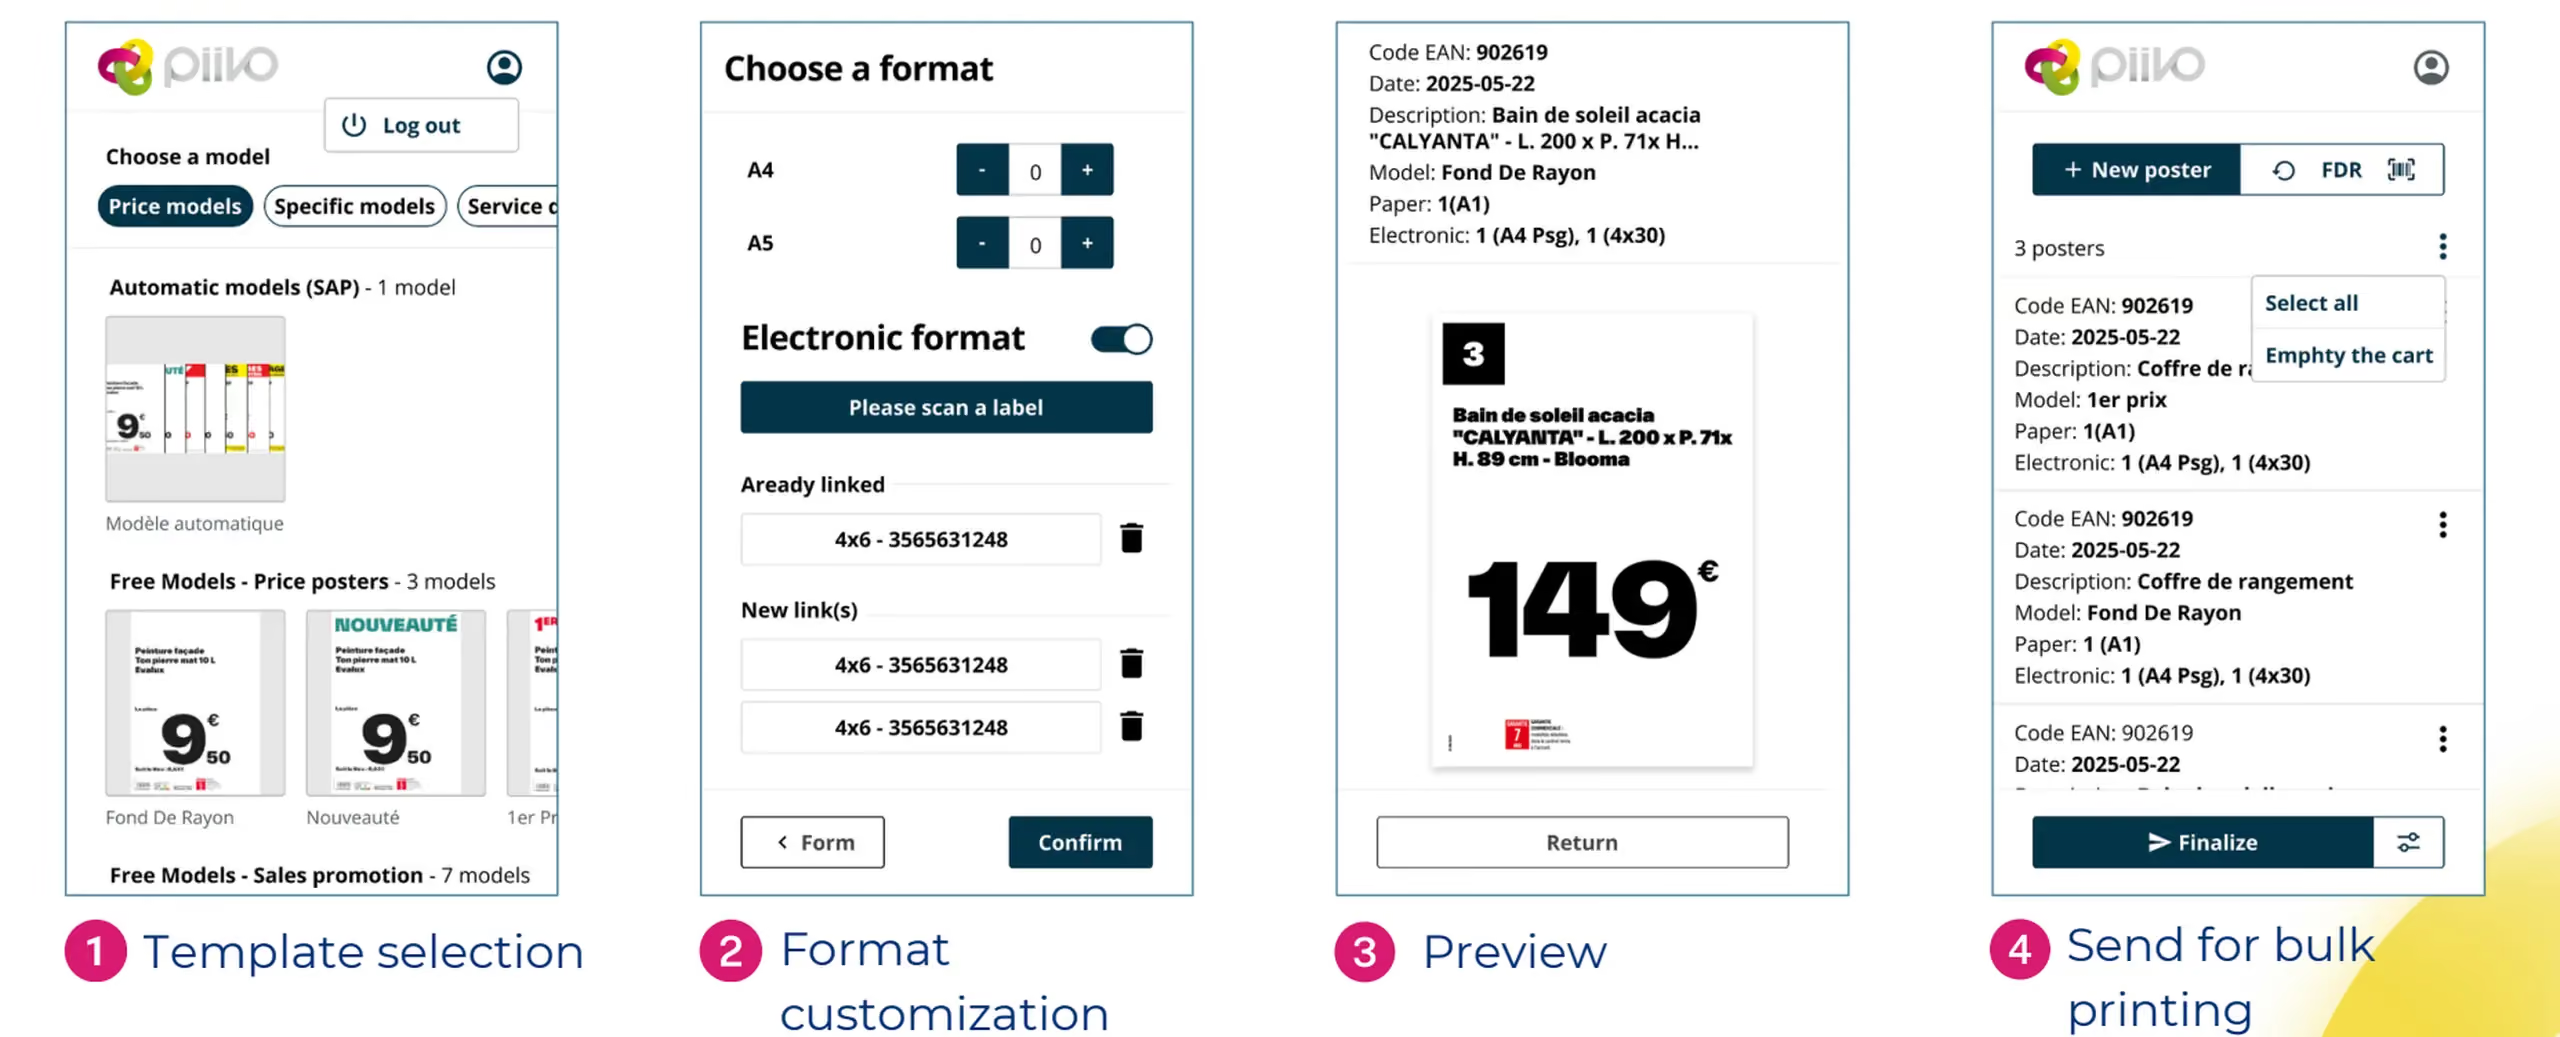
Not everything is decided at headquarters. In-store, a staff member notices a missing label, a price to correct, or a product to highlight. The mobile app allows them to take immediate action in four steps: select the template, customize the format, check the preview, and send to print, even in bulk.
Select a template, choose the format, preview, then send to print, without leaving the shop floor.
What this changes in practice
Eliminating manual data entry transforms in-store signage in three key ways.
Reliability. The displayed price matches the recorded price, mandatory information is included, and units are consistent. Signage is compliant with brand guidelines by design, as all materials are generated from the same templates.
Network consistency. Every store displays the same information, in the same format, at the same time. Customers find exactly what they saw online reflected on the shelf.
Staff time. Regarding signage tasks, one retail chain reports a time saving of approximately half. This time is reinvested into sales and customer service.
The result on the shelf: product specifications, pulled directly from the source, are displayed without manual entry, ensuring perfect alignment with electronic shelf labels.
In summary
Automating label creation isn't just about producing the same materials faster. It’s about ensuring product data flows seamlessly from the master system all the way to the shelf. Connecting to data sources, automatically selecting the right template, handling calculations, and pushing updates to printers and electronic shelf labels: every step eliminates a potential for error. The result is accurate, network-wide consistent signage, and staff freed up for what matters most: the customer.




.avif)